Wrong illustration for ARD #20740
Description
Describe the issue linked to the documentation
The last plot on the documentation page for Automatic Relevance Determination Regression (ARD) is wrong.
It makes it hard to understand the last sentence of the paragraph without running the code:
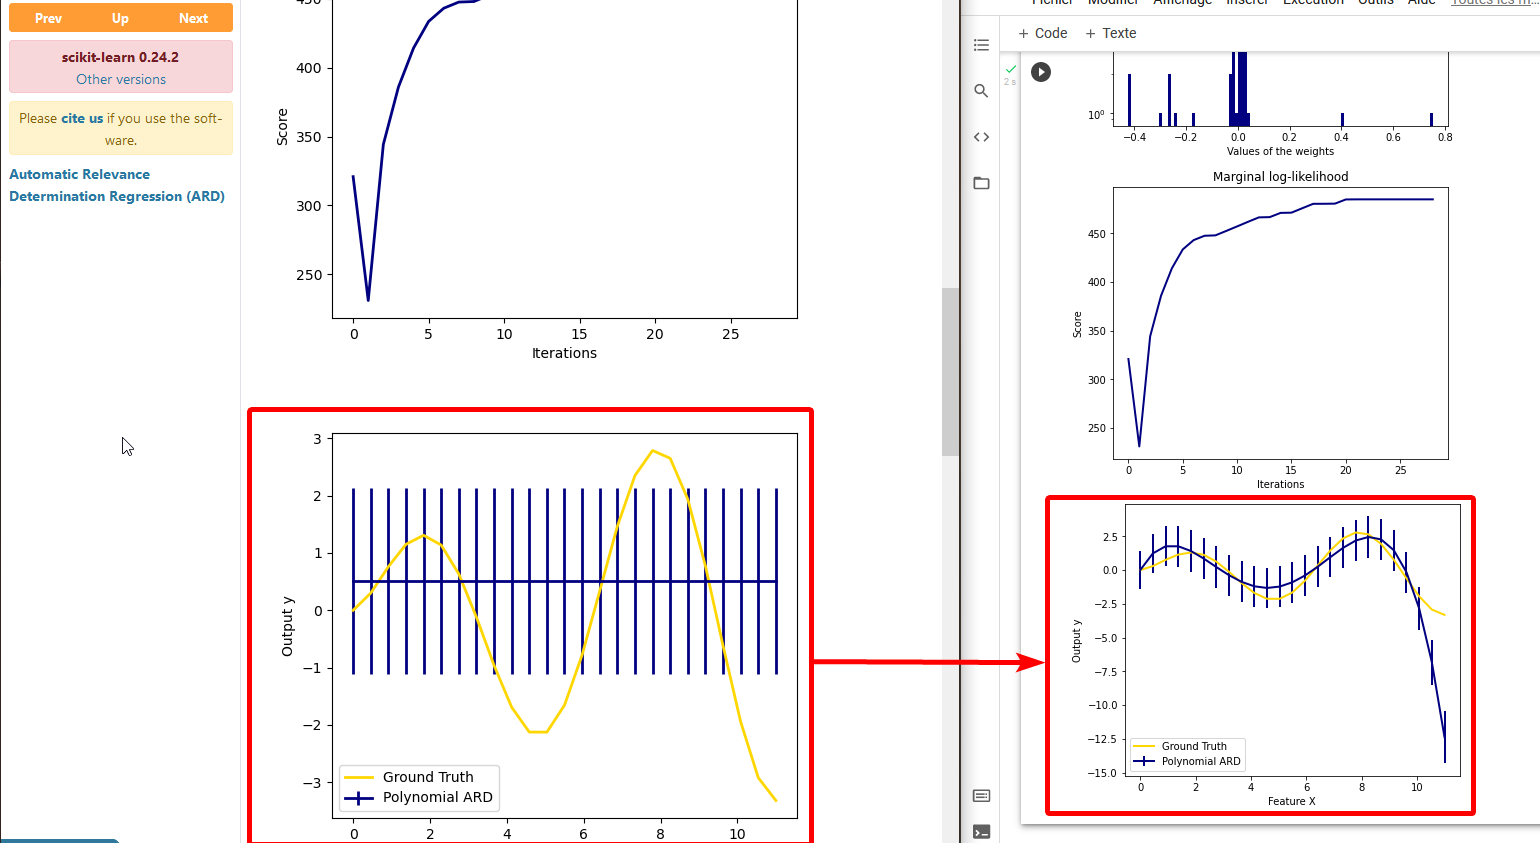
We also plot predictions and uncertainties for ARD for one dimensional regression using polynomial feature expansion. Note the uncertainty starts going up on the right side of the plot. This is because these test samples are outside of the range of the training samples.
Documentation (left) vs. Expectation (right):
Suggest a potential alternative/fix
Re-run the code and replace the illustration.