storage: Added txn wait queue related metrics#35921
storage: Added txn wait queue related metrics#35921craig[bot] merged 1 commit intocockroachdb:masterfrom
Conversation
|
This change is |
|
|
|
I haven't added any tests. Not sure how to test these. Suggestions are welcome. |
 andy-kimball
left a comment
andy-kimball
left a comment
There was a problem hiding this comment.
Reviewable status:
complete! 0 of 0 LGTMs obtained (waiting on @andreimatei, @andy-kimball, @bdarnell, @darinpp, @nvanbenschoten, and @tbg)
pkg/storage/txnwait/txnqueue.go, line 473 at r1 (raw file):
	excessiveWait := time.Minute
	excessiveWaitTimer := time.NewTimer(excessiveWait)
Is there any concern that we're spinning up a goroutine each time we get to this point in the code? Is this on a critical perf path?
 tbg
left a comment
tbg
left a comment
There was a problem hiding this comment.
I haven't added any tests. Not sure how to test these. Suggestions are welcome.
I would start by instrumenting the existing tests so that they verify the metrics at each step in the test. Additionally, there are certain invariants that should be true at the beginning end of all tests when a queue is empty. (i.e. all gauges should be zero, etc).
BTW, the existing tests are in pkg/storage/txn_wait_queue_test.go for historical reasons (tech debt).
Reviewable status:
pkg/storage/txnwait/metrics.go, line 1 at r1 (raw file):
// Copyright 2017 The Cockroach Authors.
2019 (the current year is used for new code)
pkg/storage/txnwait/metrics.go, line 37 at r1 (raw file):
		Pushees: metric.NewGauge(
			metric.Metadata{
				Name:        "txn_wait_queue.pushees",
We're wildly inconsistent in our naming of metrics, but I'd say
txnwaitqueuethroughouttxnwaitqueue.{pushee,pusher,query}.waiting
pkg/storage/txnwait/metrics.go, line 64 at r1 (raw file):
		PusherExcessiveWaitTotal: metric.NewCounter(
			metric.Metadata{
				Name:        "txn_wait_queue.pusher.excessive_wait_total",
Taking
root@127.0.0.1:54192/defaultdb> select name from crdb_internal.node_metrics WHERE name LIKE '%slow%';
         name
+---------------------+
  requests.slow.lease
  requests.slow.latch
  requests.slow.raft
(3 rows)
as a precedent, make this txnwaitqueue.pusher.slow
Also, this should be a gauge. In normal operation, it's always zero. It's nonzero exactly while a request is slow. (This is how all of the other ones work).
pkg/storage/txnwait/metrics.go, line 74 at r1 (raw file):
Histogram of durations spent in queue by pushers.
pkg/storage/txnwait/metrics.go, line 86 at r1 (raw file):
			metric.Metadata{
				Name:        "txn_wait_queue.query.wait_time",
				Help:        "The breakdown of the query's wait time when they are removed from the queue",
Ditto.
pkg/storage/txnwait/metrics.go, line 98 at r1 (raw file):
Number of deadlocks detected by the txn wait queue.
pkg/storage/txnwait/txnqueue.go, line 473 at r1 (raw file):
Previously, andy-kimball (Andy Kimball) wrote…
Is there any concern that we're spinning up a goroutine each time we get to this point in the code? Is this on a critical perf path?
Please use the same pattern from
cockroach/pkg/storage/replica_write.go
Lines 194 to 223 in 38e7961
which is allocation optimized (and prevents deadlocks).
@andy-kimball if you enter the queue, a lot more work is already being done than this txn, so it shouldn't be on the critical perf path.
pkg/storage/txnwait/txnqueue.go, line 481 at r1 (raw file):
	// queue.
	pusheeTxnTimer.Reset(0)
	startWaiting := time.Now()
Instead of calling RecordValue for this in many different places, defer a function here that does it.
pkg/storage/txnwait/txnqueue.go, line 485 at r1 (raw file):
		select {
		case <- excessiveWaitTimer.C:
			log.Warningf(ctx, "pusher request longer than %s", excessiveWait)
Please also use the same have been waiting kind of wording and print the pusher and pushee. You also need to defer a decrement to the gauge. Basically just do exactly what that other code I refer to above does.
pkg/storage/txnwait/txnqueue.go, line 694 at r1 (raw file):
	select {
	case <-ctx.Done():
		metrics.QueryWaitTime.RecordValue(time.Since(startWaiting).Nanoseconds())
Ditto about defering this once instead.
 bdarnell
left a comment
bdarnell
left a comment
There was a problem hiding this comment.
Reviewed 2 of 3 files at r1.
Reviewable status:
pkg/storage/txnwait/metrics.go, line 56 at r1 (raw file):
			metric.Metadata{
				Name:        "txn_wait_queue.queries",
				Help:        "Number of queries on the txn wait queue",
Can we say more about what a "query" is here? "Pushee" and "pusher" make sense but without going back to the code I can't remember what a "query" is.
d5224bd to
b3e5eed
Compare
 darinpp
left a comment
darinpp
left a comment
There was a problem hiding this comment.
Reviewable status:
pkg/storage/txnwait/metrics.go, line 1 at r1 (raw file):
Previously, tbg (Tobias Grieger) wrote…
2019 (the current year is used for new code)
Done.
pkg/storage/txnwait/metrics.go, line 37 at r1 (raw file):
Previously, tbg (Tobias Grieger) wrote…
We're wildly inconsistent in our naming of metrics, but I'd say
txnwaitqueuethroughouttxnwaitqueue.{pushee,pusher,query}.waiting
Done.
pkg/storage/txnwait/metrics.go, line 56 at r1 (raw file):
Previously, bdarnell (Ben Darnell) wrote…
Can we say more about what a "query" is here? "Pushee" and "pusher" make sense but without going back to the code I can't remember what a "query" is.
added some clarification based on my understanding.
pkg/storage/txnwait/metrics.go, line 64 at r1 (raw file):
Previously, tbg (Tobias Grieger) wrote…
Taking
root@127.0.0.1:54192/defaultdb> select name from crdb_internal.node_metrics WHERE name LIKE '%slow%';
         name
+---------------------+
  requests.slow.lease
  requests.slow.latch
  requests.slow.raft
(3 rows)
as a precedent, make this
txnwaitqueue.pusher.slowAlso, this should be a gauge. In normal operation, it's always zero. It's nonzero exactly while a request is slow. (This is how all of the other ones work).
Done.
pkg/storage/txnwait/metrics.go, line 74 at r1 (raw file):
Previously, tbg (Tobias Grieger) wrote…
Histogram of durations spent in queue by pushers.
Done.
pkg/storage/txnwait/metrics.go, line 86 at r1 (raw file):
Previously, tbg (Tobias Grieger) wrote…
Ditto.
Done.
pkg/storage/txnwait/metrics.go, line 98 at r1 (raw file):
Previously, tbg (Tobias Grieger) wrote…
Number of deadlocks detected by the txn wait queue.
Done.
pkg/storage/txnwait/txnqueue.go, line 473 at r1 (raw file):
Previously, tbg (Tobias Grieger) wrote…
Please use the same pattern from
cockroach/pkg/storage/replica_write.go
Lines 194 to 223 in 38e7961
which is allocation optimized (and prevents deadlocks).
@andy-kimball if you enter the queue, a lot more work is already being done than this txn, so it shouldn't be on the critical perf path.
Done.
pkg/storage/txnwait/txnqueue.go, line 481 at r1 (raw file):
Previously, tbg (Tobias Grieger) wrote…
Instead of calling
RecordValuefor this in many different places,defera function here that does it.
Done.
pkg/storage/txnwait/txnqueue.go, line 485 at r1 (raw file):
Previously, tbg (Tobias Grieger) wrote…
Please also use the same
have been waitingkind of wording and print the pusher and pushee. You also need todefera decrement to the gauge. Basically just do exactly what that other code I refer to above does.
Done.
pkg/storage/txnwait/txnqueue.go, line 694 at r1 (raw file):
Previously, tbg (Tobias Grieger) wrote…
Ditto about
defering this once instead.
Done.
tbg
left a comment
There was a problem hiding this comment.
Sorry it took me so long to get back at this. Still mostly commenting on style, but looks like this is getting there. I'll want to give all of the metrics operations another good look to see if I can spot any way in which they could diverge.
Reviewed 5 of 5 files at r2.
Reviewable status:
pkg/storage/store.go, line 4357 at r2 (raw file):
txnwait
(not txnqueue)
pkg/storage/txn_wait_queue_test.go, line 58 at r2 (raw file):
func assertAllGaugesAreZero(tc testContext) {
	testutils.SucceedsSoon(tc.TB, func() error {
		if !tc.store.GetTxnWaitMetrics().HasAllGaugesZero() {
HasAllGaugesZero should live in this file.
pkg/storage/txn_wait_queue_test.go, line 68 at r2 (raw file):
	testutils.SucceedsSoon(tc.TB, func() error {
		v := tc.store.GetTxnWaitMetrics().PusherWaiting.Value()
		if v != expectedCount {
You can use assert.Equal(t, expectedCount, v, "unexpected number of pushers") (here and everywhere else). Not mandatory.
pkg/storage/txn_wait_queue_test.go, line 131 at r2 (raw file):
		t.Errorf("expected push txn queue is enabled")
	}
	assertAllGaugesAreZero(tc)
It doesn't seem that this needs an internal SucceedsSoon.
pkg/storage/txn_wait_queue_test.go, line 137 at r2 (raw file):
		t.Fatalf("expected pendingTxn to be in txns map after enqueue")
	}
	assertPusheeCount(tc, 1)
Ditto
pkg/storage/txn_wait_queue_test.go, line 157 at r2 (raw file):
			return errors.Errorf("expected GetDependents %+v; got %+v", expDeps, deps)
		}
		assertPusheeCount(tc, 1)
Neither do these two, because it's in a SucceedsSoon already (but you need to return an error from assertPusherCount)
I think you would be even better off without all these helpers and just writing m := tc.store.TxnWaitMetrics() and then in the code
assert.Equal(t, exp, m.PusherWaiting.Count())or if you're in a SucceedsSoon
if act := m.PusherWaiting.Count(); act != exp {
  return errors.Errorf("%d pushers, but want %d", act, exp)
}
pkg/storage/txn_wait_queue_test.go, line 221 at r2 (raw file):
	assertAllGaugesAreZero(tc)
	q.Enqueue(txn)
	assertPusheeCount(tc, 1)
this would then read assert.Equal(t, 1, m.PusheeCount.Value())
pkg/storage/txnwait/metrics.go, line 49 at r2 (raw file):
				Name:        "txnwaitqueue.pushee.waiting",
				Help:        "Number of pushees on the txn wait queue",
				Measurement: "PusheeWaiting",
Is that what measurement strings look like? I think this is what gets shown on the graph axis. Maybe "Waiting Pushees"? Ditto for the other metrics.
pkg/storage/txnwait/txnqueue.go, line 485 at r1 (raw file):
Previously, darinpp wrote…
Done.
nit: pusher %s: have been waiting ... rolls off the tongue better. I'd also unify the two cases (using the empty uuid when no pusher) simply because we'll easily see what's going on from the log message and also in practice there will always be a txn (we use nontransactional reqs for barely anything).
darinpp
left a comment
There was a problem hiding this comment.
Reviewable status:
pkg/storage/store.go, line 4357 at r2 (raw file):
Previously, tbg (Tobias Grieger) wrote…
txnwait
(not txnqueue)
renamed.
pkg/storage/txn_wait_queue_test.go, line 58 at r2 (raw file):
Previously, tbg (Tobias Grieger) wrote…
HasAllGaugesZeroshould live in this file.
moved.
pkg/storage/txn_wait_queue_test.go, line 68 at r2 (raw file):
Previously, tbg (Tobias Grieger) wrote…
You can use
assert.Equal(t, expectedCount, v, "unexpected number of pushers")(here and everywhere else). Not mandatory.
I changed it.
pkg/storage/txn_wait_queue_test.go, line 131 at r2 (raw file):
Previously, tbg (Tobias Grieger) wrote…
It doesn't seem that this needs an internal
SucceedsSoon.
I agree that it doesn't need. I changed to be explicit. But I do think that this is worse than the way it was before. What I want to test is that gauges are set in a certain way at the point of the test. Whether they are being set synchronously in a direct call or in a go routine or the modifications are deferred - isn't important. A switch from one to the other shouldn't require me to modify tests. As is right now - it will require.
pkg/storage/txn_wait_queue_test.go, line 137 at r2 (raw file):
Previously, tbg (Tobias Grieger) wrote…
Ditto
fixed too.
pkg/storage/txn_wait_queue_test.go, line 157 at r2 (raw file):
Previously, tbg (Tobias Grieger) wrote…
Neither do these two, because it's in a
SucceedsSoonalready (but you need to return an error fromassertPusherCount)I think you would be even better off without all these helpers and just writing
m := tc.store.TxnWaitMetrics()and then in the codeassert.Equal(t, exp, m.PusherWaiting.Count())or if you're in a
SucceedsSoonif act := m.PusherWaiting.Count(); act != exp { return errors.Errorf("%d pushers, but want %d", act, exp) }
changed too.
pkg/storage/txn_wait_queue_test.go, line 221 at r2 (raw file):
Previously, tbg (Tobias Grieger) wrote…
this would then read
assert.Equal(t, 1, m.PusheeCount.Value())
changed.
darinpp
left a comment
There was a problem hiding this comment.
Reviewable status:
pkg/storage/txnwait/metrics.go, line 49 at r2 (raw file):
Previously, tbg (Tobias Grieger) wrote…
Is that what measurement strings look like? I think this is what gets shown on the graph axis. Maybe "Waiting Pushees"? Ditto for the other metrics.
Good catch. I didn't see that this is used as labels on the graphs. It makes more sense that way you suggest.
darinpp
left a comment
There was a problem hiding this comment.
Reviewable status:
pkg/storage/txnwait/txnqueue.go, line 485 at r1 (raw file):
Previously, tbg (Tobias Grieger) wrote…
nit:
pusher %s: have been waiting ...rolls off the tongue better. I'd also unify the two cases (using the empty uuid when no pusher) simply because we'll easily see what's going on from the log message and also in practice there will always be a txn (we use nontransactional reqs for barely anything).
Modified the way you are suggesting. Agreed that it is better.
tbg
left a comment
There was a problem hiding this comment.
You're going to want to add a category to the release note.
Something like
Release note (admin ui change): Added txn wait queue related metrics for debugging (available only via the custom chart page).
Reviewed 5 of 5 files at r3.
Reviewable status:
pkg/storage/txn_wait_queue_test.go, line 131 at r2 (raw file):
Previously, darinpp wrote…
I agree that it doesn't need. I changed to be explicit. But I do think that this is worse than the way it was before. What I want to test is that gauges are set in a certain way at the point of the test. Whether they are being set synchronously in a direct call or in a go routine or the modifications are deferred - isn't important. A switch from one to the other shouldn't require me to modify tests. As is right now - it will require.
By that same reasoning, should everything we assert through all of the unit tests in the code base tolerate asynchronicity? I think it is better to assume no asynchronicity by default and to adapt only when it is found to be necessary. We should also generally avoid SucceedsSoon and by that token, not use it unless actually necessary.
pkg/storage/txn_wait_queue_test.go, line 57 at r3 (raw file):
}

func hasAllGaugesZero(tc testContext) bool {
When this test fails, it'll be unclear which gauge exactly triggered it. I'd do this as
func hasAllGaugesZero(m *txnwait.Metrics) error {
   if act := m.PusheeWaiting.Value(); act != 0 { return errors.Errorf("PusheeWaiting=%d", act) }
  ...
   return nil
}
All of this is unfortunately a bit verbose, and can be done better, but let's keep it basic for now.
pkg/storage/txnwait/metrics.go, line 56 at r1 (raw file):
QueryTxn loads the pusher's own transaction (and I guess the pushee's too) on some timer to make sure they eventually get an up to date view. It also returns the txns waiting on the query-ee which I guess is used for deadlock detection. The txnwaitqueue also lets QueryTxn wait until the txn record updates relative to what the querier provided. I can't say that I understand it any better than that. In light of that maybe
Number of transaction status queries waiting for an updated transaction record
pkg/storage/txnwait/metrics.go, line 77 at r3 (raw file):
			metric.Metadata{
				Name:        "txnwaitqueue.pusher.wait_time",
				Help:        "Histogram of durations spent in queue by pushers.",
Figure out what the convention is (trailing dot or not?) and use the same throughout. I think it's no trailing dot based on what I see in storage/metrics.go.
pkg/storage/txnwait/txnqueue.go, line 501 at r3 (raw file):
				timeutil.Since(tBegin).Seconds(),
				req.PusheeTxn.ID.Short(),
			)
In other places, we print a corresponding message that gives the actual wait time. I'd do something similar here by defer'ing a closure that prints the time again when it fires.
See
cockroach/pkg/storage/replica_write.go
Lines 216 to 225 in cf449c6
darinpp
left a comment
There was a problem hiding this comment.
updated the release note category.
Reviewable status:
pkg/storage/txn_wait_queue_test.go, line 131 at r2 (raw file):
Previously, tbg (Tobias Grieger) wrote…
By that same reasoning, should everything we assert through all of the unit tests in the code base tolerate asynchronicity? I think it is better to assume no asynchronicity by default and to adapt only when it is found to be necessary. We should also generally avoid
SucceedsSoonand by that token, not use it unless actually necessary.
No, I don't think everything should be tested in a way that tolerates asynchronicity. I could imagine many cases where deferring the result will be a bug so the test shouldn't allow for immediate failure and success after a wait and retry. However for the metrics case above this issue doesn't exist and all metrics reporting should ideally be deferred to not slow down the main code.
pkg/storage/txn_wait_queue_test.go, line 57 at r3 (raw file):
Previously, tbg (Tobias Grieger) wrote…
When this test fails, it'll be unclear which gauge exactly triggered it. I'd do this as
func hasAllGaugesZero(m *txnwait.Metrics) error {
   if act := m.PusheeWaiting.Value(); act != 0 { return errors.Errorf("PusheeWaiting=%d", act) }
  ...
   return nil
}
All of this is unfortunately a bit verbose, and can be done better, but let's keep it basic for now.
Refactored it. I agree that this is better.
pkg/storage/txnwait/metrics.go, line 56 at r1 (raw file):
Previously, tbg (Tobias Grieger) wrote…
QueryTxnloads the pusher's own transaction (and I guess the pushee's too) on some timer to make sure they eventually get an up to date view. It also returns the txns waiting on the query-ee which I guess is used for deadlock detection. The txnwaitqueue also lets QueryTxn wait until the txn record updates relative to what the querier provided. I can't say that I understand it any better than that. In light of that maybeNumber of transaction status queries waiting for an updated transaction record
Changed.
pkg/storage/txnwait/metrics.go, line 77 at r3 (raw file):
Previously, tbg (Tobias Grieger) wrote…
Figure out what the convention is (trailing dot or not?) and use the same throughout. I think it's no trailing dot based on what I see in
storage/metrics.go.
No dot seems to be the default. I fixed the few offenders.
pkg/storage/txnwait/txnqueue.go, line 501 at r3 (raw file):
Previously, tbg (Tobias Grieger) wrote…
In other places, we print a corresponding message that gives the actual wait time. I'd do something similar here by
defer'ing a closure that prints the time again when it fires.See
cockroach/pkg/storage/replica_write.go
Lines 216 to 225 in cf449c6
Changed.
tbg
left a comment
There was a problem hiding this comment.
Thanks. Almost ready!
Reviewed 3 of 3 files at r4.
Reviewable status:
pkg/storage/txnwait/txnqueue.go, line 500 at r4 (raw file):
			defer func() {
				metrics.PusherSlow.Dec(1)
				log.Warningf(ctx, "pusher %s finished waiting after %.2fs for %s pushee",
This message is in addition to the one after one minute. Also please update the wording for both to
pusher %s: .... for pushee %s.
Resolves cockroachdb#31106

The new metrics are:

- current count of pushees, pushers and queries
- the total number of instances where a pusher had to wait more than 1 min on the queue
- histograms for the time spent waiting on the queue for pushers and queries
- total number of deadlocks

Release note (admin ui change): Added txn wait queue related metrics for debugging (available only via the custom chart page)
darinpp
left a comment
There was a problem hiding this comment.
Reviewable status:
pkg/storage/txnwait/txnqueue.go, line 500 at r4 (raw file):
Previously, tbg (Tobias Grieger) wrote…
This message is in addition to the one after one minute. Also please update the wording for both to
pusher %s: .... for pushee %s.
Ah..makes sense to log both. Updated.
tbg
left a comment
There was a problem hiding this comment.
Reviewed 1 of 1 files at r5.
Reviewable status:
|
bors r+ Thanks @darinpp! After this has merged, could you backport it to |
35921: storage: Added txn wait queue related metrics r=tbg a=darinpp Resolves #31106 The new metrics are: - current count of pushees, pushers and queries - the total number of instances where a pusher had to wait more than 1 min on the queue - histograms for the time spent waiting on the queue for pushers and queries - total number of deadlocks Here is a sample chart for the current count of pushees, pushers, queries as well as the total number of cases where a pusher waited more than 1 min 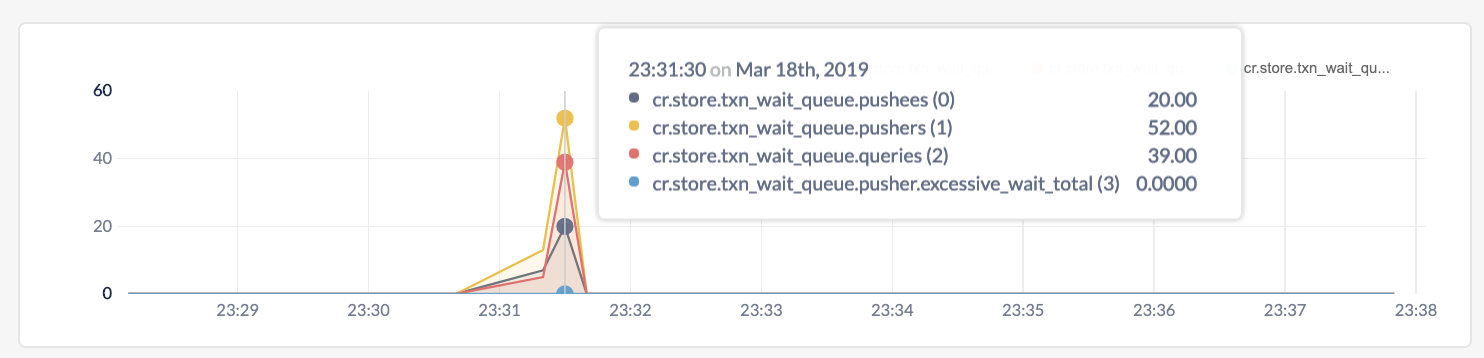 Here is a sample chart of the cumulative count of the deadlocks expressed as rate 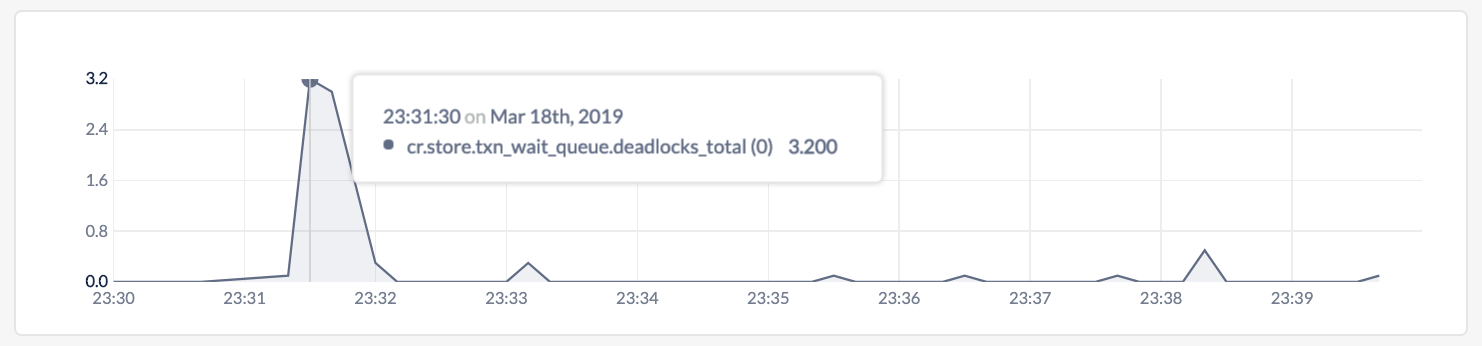 Here is a sample chart of the pusher wait time breakdown 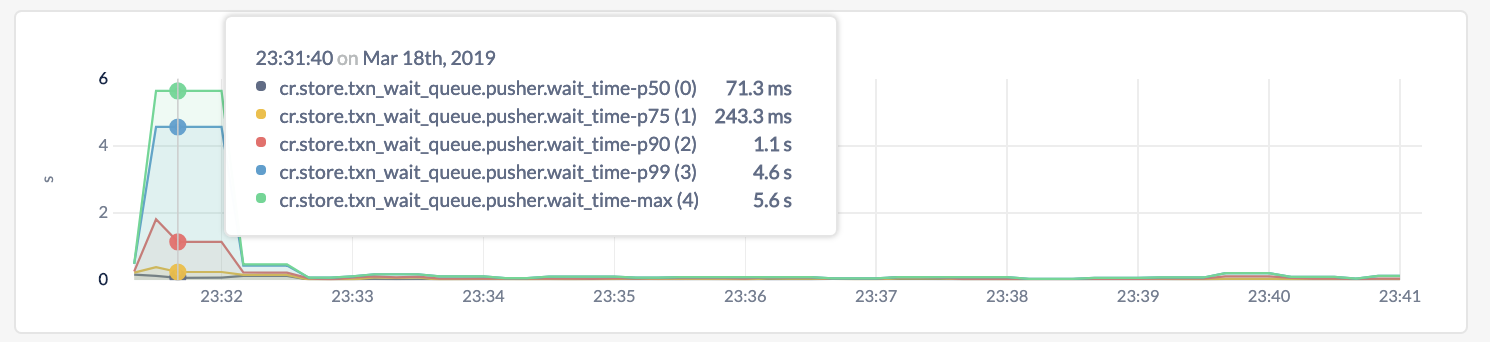 and a sample chart of the queue wait time breakdown 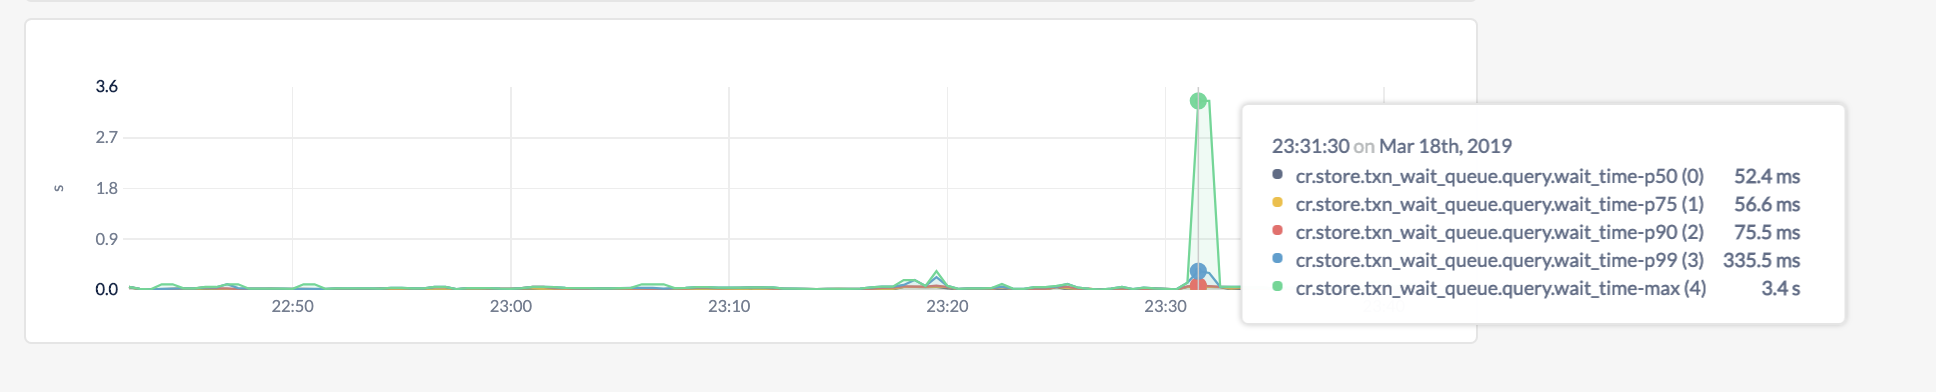 Co-authored-by: Darin Peshev <darinp@gmail.com>
Build succeeded |
Resolves #31106
The new metrics are:
Here is a sample chart for the current count of pushees, pushers, queries as well as the total number of cases where a pusher waited more than 1 min

Here is a sample chart of the cumulative count of the deadlocks expressed as rate

Here is a sample chart of the pusher wait time breakdown

and a sample chart of the queue wait time breakdown
