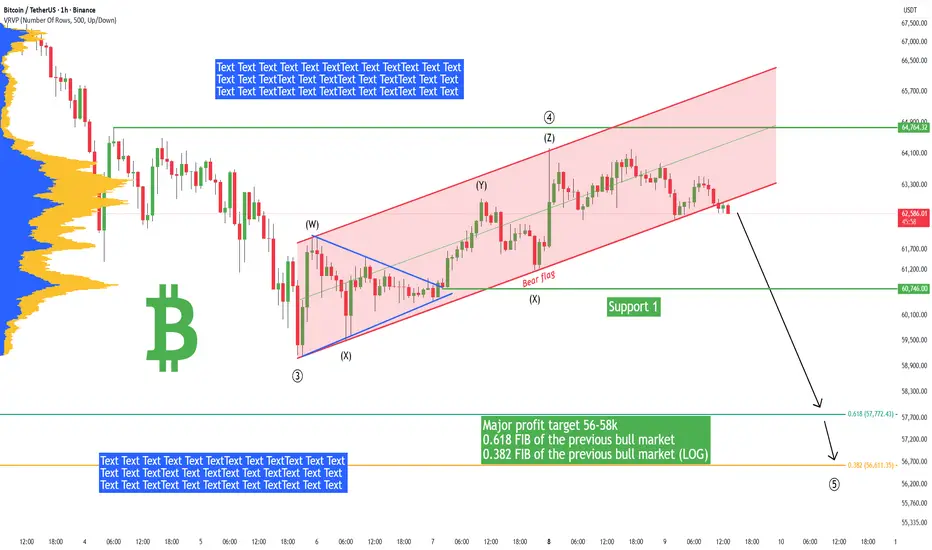
Bitcoin - Another drop starting! 57k target, then huge rallye!I believe Bitcoin is ready for another huge drop to 57k! I have the following reasons for this statement:
Bitcoin still didn't hit the major target 0.618 Fibonacci retracement of the previous bull market (2022-2025). It's like without this achievement, there is no way to go up.
Near this 0.618 FIB, there is a 0.382 FIB on the log scale. This is another major target that the bears should hit before any pumps. 0.382 is basically inverted 0.618 (0.618+0.382=1.000).
Also on the weekly chart there is unswept liquidity below the previous swing low (58946). The majority of traders have their stop loss here, so the whales want liquidity.
I still don't see any buying activity from whales, the chart looks pretty bearish, the wave structures are corrective rather than impulsive from the Elliott Wave perspective.
Currently I am bearish and patiently waiting for the major target of 57k. I think this is a pretty good opportunity to take profit and enter a long position. I believe Bitcoin is not going to go to 42k in a straight line because the market usually moves in waves. I expect 70k after we hit 57k.
On the chart we can see another bear flag pattern with a corrective structure of WXYXZ. This is a pretty bearish combo, so I am not really buying at this moment. But what about you?
Write a comment with your altcoin + hit the like button, and I will make an analysis for you in response. Trading is not hard if you have a good coach! I am very transparent with my trades. Thank you, and I wish you successful trades!
Community ideas
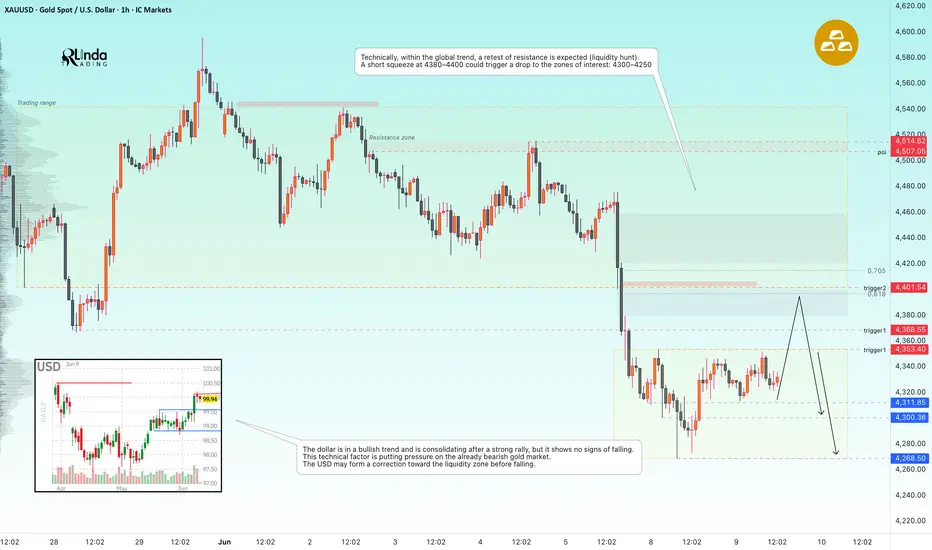
GOLD - A countertrend correction before a decline ICMARKETS:XAUUSD is in a corrective phase after printing a new low at 4268. Both the local and global bearish trends remain intact; however, the geopolitical backdrop continues to be unstable
Gold is undergoing a fundamental and technical shift to the downside, driven by several factors acting simultaneously: a sharp increase in expectations for further Fed rate hikes (now above 70% by December), a break and close below the 200-day moving average for the first time since October 2023, a stronger U.S. dollar above the psychological 100.0 level, and rising Treasury yields toward the 4.55–4.57% range
Technically, the market remains under pressure, and short positions continue to be the preferred strategy. A short squeeze into a liquidity zone could trigger another sharp decline toward support and lower target levels. However, a sudden positive shift in the fundamental backdrop could invalidate the local bearish structure
Resistance levels: 4353, 4368, 4400
Support levels: 4311–4300, 4268
The U.S. dollar is consolidating after a strong rally but shows no signs of weakness. This technical factor continues to weigh on an already bearish gold market.
From a technical perspective, gold may perform a retest of resistance as part of a liquidity-hunting move. A short squeeze into the 4380–4400 area could trigger a decline toward the key zones of interest at 4300–4250
Best regards, R. Linda
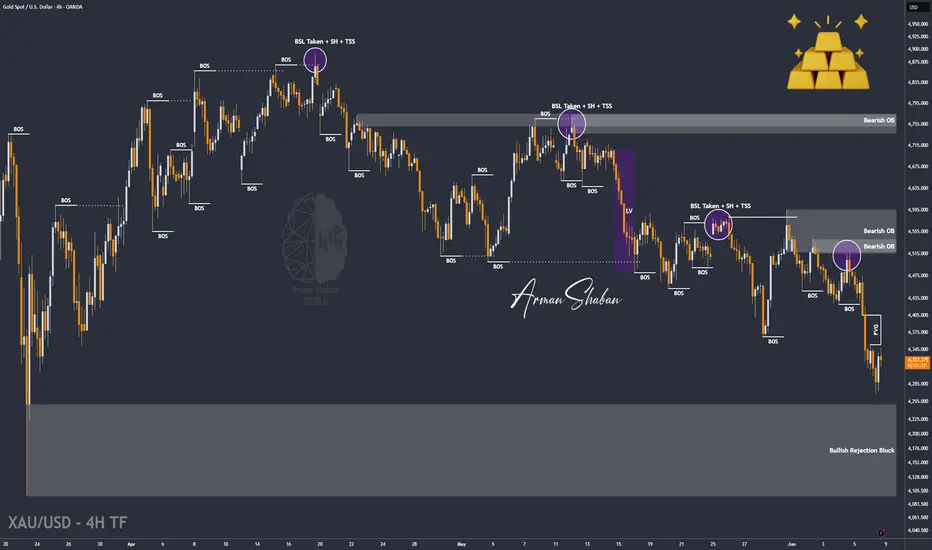
XAU/USD | Gold Continues To Respect The Bearish Structure!By analyzing the #Gold chart on the 4H timeframe, we can see that price once again followed the scenario discussed in our previous update. After reacting perfectly from the supply zone we highlighted, Gold entered another aggressive sell-off.
As expected, sellers regained control from the upper supply area and price collapsed sharply, reaching a fresh low around $4269. The renewed conflict between Iran and Israel acted as a catalyst behind this move. However, after news regarding another ceasefire emerged, Gold experienced a strong rebound and managed to recover toward the $4346 region.
Currently, Gold is trading around the $4330 area. Despite this recovery, in my view the broader structure remains bearish and the recent bounce looks more like a temporary correction rather than the beginning of a new bullish trend.
From a structural perspective, the nearest supply zones are now located around $4350 – $4380, followed by a stronger resistance cluster between $4420 – $4450. On the downside, the closest demand zones are sitting around $4250 – $4275, with deeper structural support located between $4190 – $4220.
In my view, as long as Gold remains below the higher supply zones, the probability of another heavy bearish leg remains elevated. The next medium-term downside targets to monitor are $4200, followed by $4100, and potentially the major psychological level around $3999 if bearish momentum accelerates further.
For now, Gold remains extremely headline-driven and highly sensitive to geopolitical developments. Any new escalation or de-escalation between Iran and Israel could trigger violent swings in both directions. Nevertheless, the broader bias remains bearish until proven otherwise.
This analysis will be updated as the market evolves.
Please support me with your likes and comments to motivate me to share more analysis with you and share your opinion about the possible trend of this chart with me !
Best Regards , Arman Shaban
GBPUSDHello Traders! 👋
What are your thoughts on GBPUSD?
GBP/USD is moving within a descending channel. Price recently failed to break above the highlighted resistance zone and was rejected, falling back below this key area. In addition, the short-term ascending trendline has been broken, signaling a potential shift in momentum in favor of the bears.
As long as the price remains below the resistance zone, a pullback toward the broken trendline and resistance area could provide a selling opportunity. After completing the retest, GBP/USD may resume its downward movement toward the lower support levels and the next bearish targets shown on the chart.
Rejection from the resistance zone and successful retest of the broken trendline could trigger another leg lower toward the 0.786 Fibonacci level .
What do you think about GBP/USD? Share your view below.
If you found this analysis helpful, please support it with a like and share your thoughts in the comments! Good luck with your trades!❤️

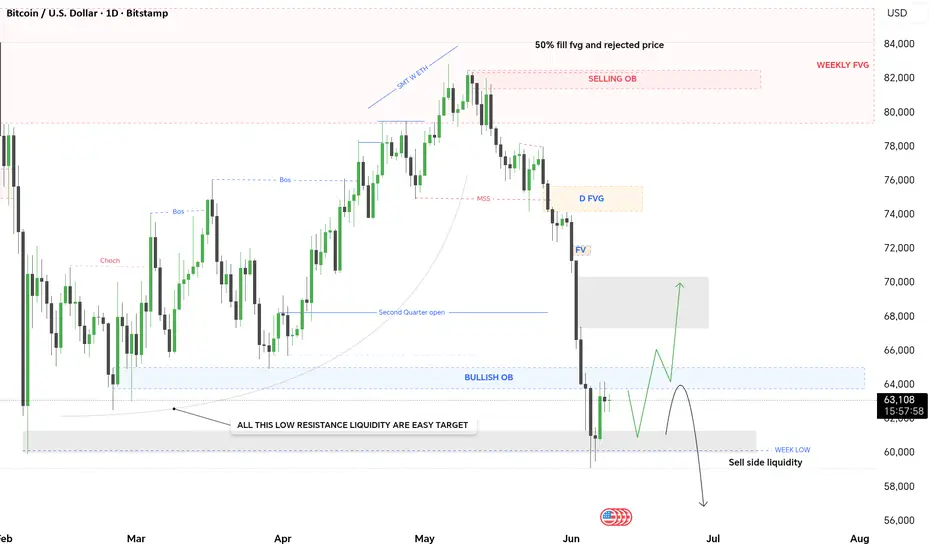
Bitcoin: 2 Scenarios, 1 Ultimate Buying ZoneEveryone is anticipating a strong Bitcoin bounce since it is sitting at a key daily support zone. However, looking closely at the daily chart structure, this price action looks highly corrective and exhausted rather than a high-momentum reversal.
Here is the professional breakdown of the current technical structure and the two primary scenarios moving forward.
Technical Breakdown from the Chart:
Weekly FVG & Selling OB Rejection: Price cleanly tapped into the 50% fill of the Weekly Fair Value Gap (FVG) and faced strong institutional rejection at the Selling Order Block (OB) near $82k–$83k.
Market Structure Shift (MSS): The aggressive drop down created a clear Market Structure Shift (MSS) to the bearish side, leaving a daily D FVG unfilled above around $74k.
Liquidity Pool Target: There is a heavy pool of Low Resistance Liquidity acting as an easy target (magnet) straight down to the Sell-side Liquidity / Week Low resting right around the $60k psychological support line.
Scenario 1: Clean Breakdown (25% Probability)
If Bitcoin breaks below the current major support zone ($58k–$62k) without any significant reaction, it opens the floodgates.
Outlook: No miracle recovery. It will drift straight down into the long-term institutional accumulation zone.
Main Buy Zone: $35k–$48k
Scenario 2: Trap Bounce Before Pain (75% Probability) — Primary Bias
The market loves to trap late retail buyers before the final flush. This is the most likely road map:
The Dead Cat Bounce: Price holds the Bullish OB temporarily, generating a short-term technical bounce of a few percent to induce FOMO.
The Trap: Unless BTC cleanly reclaims its major moving averages and flips the bearish structure above, this bounce is purely a trap.
The Continuation: A sharp rejection from the relief rally, driving down to clean up the resting sell-side liquidity.
The Macro Confluence (S&P 500 Risk)
Crypto does not move in a vacuum. The S&P 500 is showing signs of exhaustion at historical highs. If equities start dropping, Bitcoin will act heavily as a risk asset.
S&P 500 Key Levels to Watch: 7100–6900 (First major warning zone) and 6300 (Deep stress level for Tech & Crypto).
Execution Strategy
Current Major Support: $58k–$62k
Next Reaction Zone: $50k–$55k
Ultimate Loading Zone: $35k–$48k
Conclusion: I am remaining highly defensive here. No interest in chasing short-term weak bounces in a structurally bearish setup. Capital preservation is priority #1. Let the market present the real risk/reward opportunity lower.
Not financial advice. Just a purely technical, data-driven view.
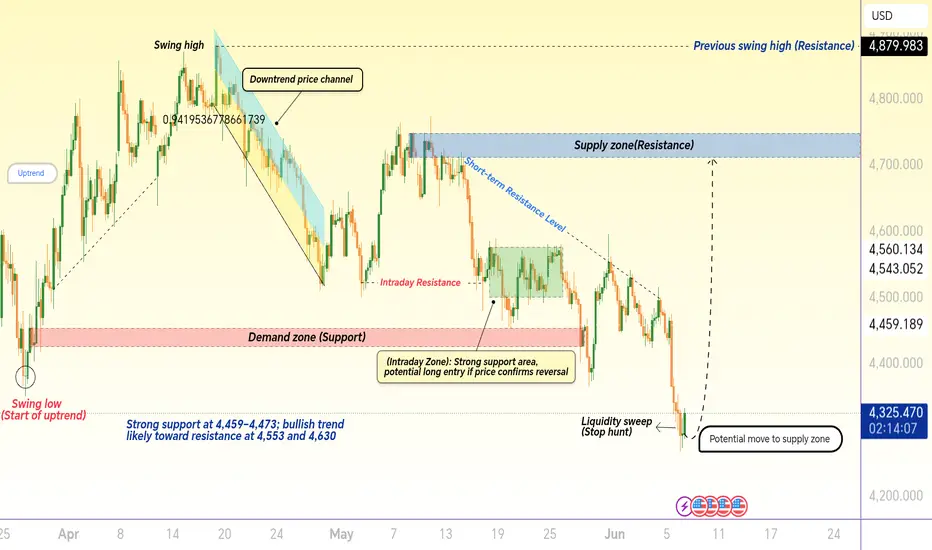
Gold (XAU/USD)Technical Analysis – Key Support & Resistance ZoneThis chart highlights major Gold support and resistance levels, with a green box marking a strong demand zone and an orange box showing supply/resistance areas. Trendlines illustrate bullish and bearish channels, while the dashed line near the demand zone indicates potential reversal or breakout points. Traders can monitor the demand area for possible long entries and target the resistance zones for profit-taking, providing a structured approach to trade planning and risk management
BTCUSDT: Signals Potential Upside From Demand Zone To 64KHello traders! Here’s my technical outlook based on the current BTCUSDT (2H) chart structure. BTCUSDT previously traded inside a broad consolidation range before breaking below support and starting a strong bearish trend. After the breakdown, price continued to decline beneath a descending trendline, while multiple bearish breakouts confirmed that sellers remained firmly in control. Currently, BTCUSDT is trading above the 60,500 Buyer Zone while remaining below the 64,000 Seller Zone. Price recently rebounded from support and attempted to recover, but the descending trendline and resistance zone continue to cap bullish momentum. As long as BTCUSDT holds above the 60,500 Buyer Zone and respects the ascending support line, a short-term recovery scenario remains valid. A bounce from current levels could push price toward the 64,000 Seller Zone (TP1). Please share this idea with your friends and click “Boost” 🚀

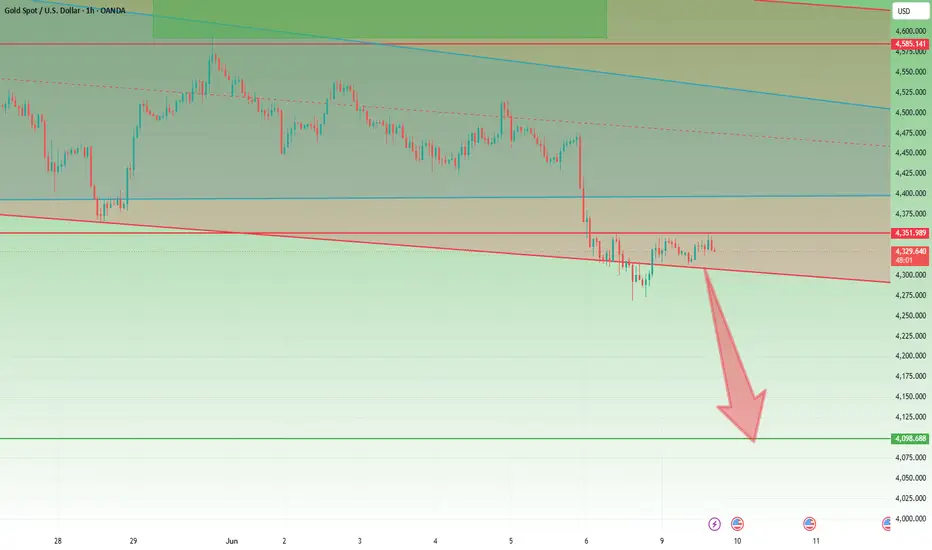
XAUUSD: Pullback Opportunity Within DowntrendGold remains under bearish pressure after breaking below the descending channel support and confirming a series of lower highs and lower lows. The recent decline has pushed price into a key support zone, where a short-term reaction or pullback could occur.
If price retests the highlighted resistance area and fails to reclaim it, sellers may maintain control and drive the market toward the next downside target. The overall market structure remains bearish while price trades below resistance.
Key Levels:
Resistance Zone: 4,365 – 4,385
Support Zone: 4,265 – 4,285
Bearish Target: Around 4,120
Trade Idea: Watch for bearish confirmation around resistance before considering continuation toward lower levels. Always manage risk and wait for confirmation before making trading decisions.
This analysis is for educational purposes only and not financial advice
Gold Finds Support Below 4300 – But Bulls Still Have Work to Do.Yesterday, after a double dip below the 4300 zone, Gold finally found buyers and staged a recovery toward the 4350 resistance area.
Honestly, after last week's nearly 2000-pip sell-off, such a rebound was perfectly normal and even healthy from a market structure perspective.
The important question, however, is not whether Gold can bounce.
The important question is whether the bounce changes the trend.
And from my perspective, the answer is still no.
Looking closely at the chart, the recovery appears corrective rather than impulsive. The market is climbing, but it lacks the type of aggressive buying pressure that would normally signal a genuine trend reversal.
On the very short term, a small Head & Shoulders pattern is visible, and yes, a break above the 4350 neckline could trigger another push higher.
However, even if that happens, I believe the upside remains limited unless buyers can do something much more important:
➡️ reclaim and hold above the 4400 zone.
Until that happens, I continue to view rallies as corrections inside a broader bearish trend rather than the start of a new bullish phase.
Trading View
My view remains unchanged:
➡️ Bearish
➡️ Selling rallies remains my preferred strategy
Only sustained buying pressure and acceptance above the 4400 area would make me reconsider that outlook.
Until then, for me, Gold still looks like a market catching its breath rather than changing direction
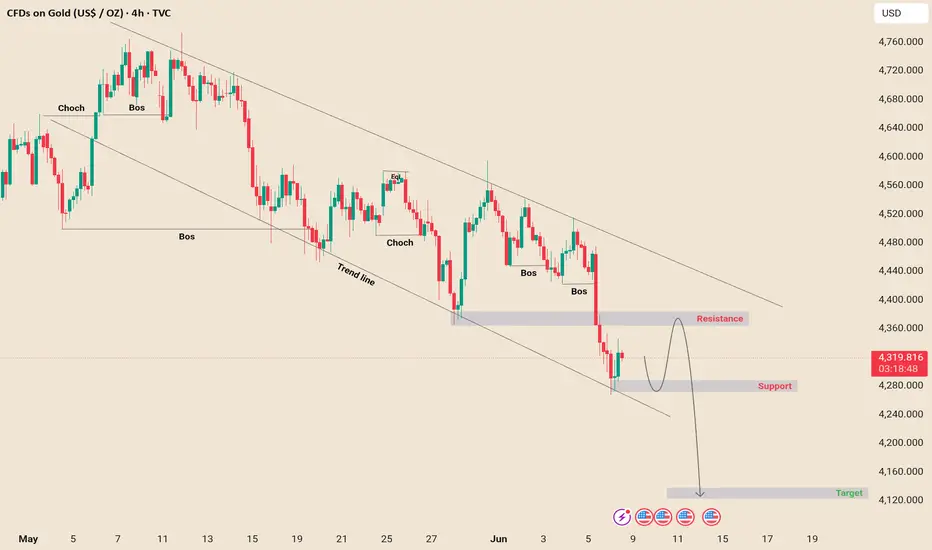
XAUUSD Short: Bounce Under Pressure - Is 4,250$ Next Target?Hello traders! Here’s my technical outlook based on the current XAUUSD (3H) chart structure. XAUUSD previously traded inside an ascending channel and reached a major pivot point near the upper boundary. After losing bullish momentum, price broke below channel support and entered a descending channel.
Currently, XAUUSD is trading below the 4,410 supply zone while holding above the 4,250 demand zone. Following a strong bearish breakout from the descending channel, price found support near demand and is attempting a short-term recovery.
As long as XAUUSD remains below the 4,410 supply zone and continues to respect the bearish market structure, the bearish scenario remains valid. A rejection from current levels could push price back toward the 4,250 demand zone (TP1). Manage your risk!
old 30Min Engaged ( Bullish Reversal Detected )HANZO MARKET LIQUIDITY REPORT
Gold
Timeframe: 30min (Volume Basis)
Scale: Higher Timeframe Context / Deep Volume analysis
━━━━━━━━━━━━━━━━━━━━━━
Market Observation
This analysis is focusing on structural behavior, liquidity zones, Volume analysis
and key areas of interest within the current range.
━━━━━━━━━━━━━━━━━━━━━━
Market Bias
Full liquidity Map
━━━━━━━━━━━━━━━━━━━━━━
🔥Bullish Reversal
Key Volume Zone : 4330 Area
━━━━━━━━━━━━━━━━━━━━━━
Structure Factors:
• Higher timeframe Volume reaction level
• High-volume / Hidden
• Range Defend structure
• Volume Stacking
• Quarter Volume

XAUUSD REJECTION CONFIRMED – GOLD READY TO DROP?Gold Facing Heavy Resistance – Bears Preparing For Impact! OANDA:XAUUSD
XAUUSD is currently trading below a major supply/resistance zone around 4370 – 4380, where price has faced multiple rejections, signaling strong seller presence. After a sharp bearish impulse, gold attempted to recover but is still struggling to reclaim the key zone. The repeated rejection from resistance suggests that sellers remain in control unless bulls break and close above the supply area with strong momentum.
From a price action perspective, gold may attempt a short-term retracement into resistance before continuation lower. If the supply zone continues holding, bearish momentum could drive price toward the next key demand/support levels. The current structure favors a sell-on-rejection scenario, especially if price forms bearish confirmation candles near resistance.
🔑 Key Levels:
Major Supply / Resistance Zone: 4370 – 4380 (strong rejection area)
First Bearish Target / Support: 4240 – 4250 (reaction zone)
Psychological Support Zone: 4185 – 4200 (major demand area)
📊 Market Outlook:
✔️ Bearish below the 4370–4380 supply zone
✔️ Multiple rejections show seller dominance
✔️ Possible retracement before downside continuation
✔️ Breakdown could accelerate bearish momentum toward support
💬 If you found this analysis useful, don’t forget to support with a Like 👍 and share your view in the comments!
⚠️ Disclaimer: This analysis is for educational purposes only and not financial advice. Always wait for confirmation and apply proper risk management before entering any trade.

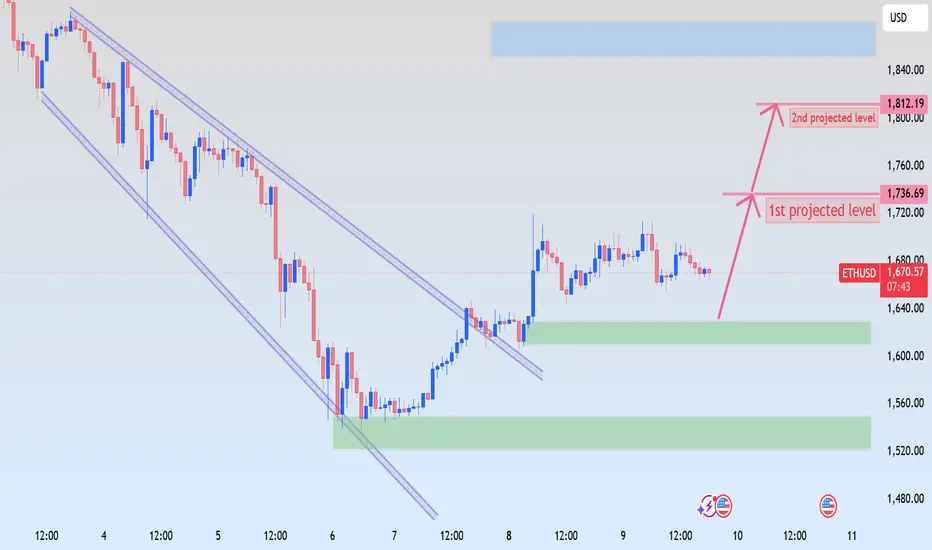
ETHUSD | Bullish Breakout Eyes Higher Targets📊 ETHUSD (H4 Timeframe)
🔍 Analysis:
• Strong recovery after breaking out of the descending channel ✅
• Price is consolidating above the reclaimed support zone ✅
• Buyers continue defending the 1,610–1,625 demand area
• Bullish structure remains intact above support
🎯 Bullish Targets:
✅ TP1: 1,736.69 (1st Projected Level)
✅ TP2: 1,812.19 (2nd Projected Level)
📌 Support Zone:
1,610 – 1,625
🛑 Stop Loss:
Below 1,580
🚀 Trade Idea:
BUY on bullish confirmation or continuation from the support zone.
📈 Outlook:
As long as price remains above the 1,610–1,625 support area, buyers could push ETHUSD toward 1,736.69 first and potentially 1,812.19 in the coming sessions.
Monk Mode for Traders: My Personal RulesTrading discipline does not start on the chart. It starts with what you do when nobody is watching.
🟠 Discipline Starts Before Trading
Many traders want better psychology, but they only try to fix it after they enter a trade. That is too late. If you cannot follow simple rules in normal life, it becomes much harder to follow trading rules when money is moving.
Monk mode for traders is simple. It means building a daily routine that trains you to do the right thing even when you do not feel like doing it. This can be going to the gym, reading, taking a cold shower if it suits you, cleaning your space, waking up on time, or doing focused work without checking your phone every few minutes.
These things are not magic. They just build the habit of doing uncomfortable things. Trading is full of uncomfortable things. Closing a losing trade is uncomfortable. Waiting for a setup is uncomfortable. Skipping a trade when you want action is uncomfortable.
If your daily life is built around avoiding discomfort, trading will expose it fast.
The goal is not to become perfect. We are all humans. The goal is to become a little better at choosing the rule over the feeling.
🟠 Do One Hard Thing Every Day
A trader needs to practice doing things they do not want to do. This is where monk mode becomes useful. Every day, choose one simple hard thing and complete it without drama. It can be a workout when you feel lazy. It can be reading 10 pages instead of scrolling. It can be sitting down to journal your trades even after a bad day. The task does not need to be extreme. It only needs to train the same mental muscle: “I do what I said I would do.”
That same skill appears in trading. When your stop is hit, you need to close the trade. When price is stuck in a range, you need to wait. When the setup is weak, you need to skip it. None of that feels fun in the moment, but it protects the account.
So the real question is simple: if you avoid small discomfort every day, how will you handle big discomfort during a trade?
🟠 Use Rules Before Emotions Appear
Good rules are made before emotions get loud. Once you are already in a losing trade, your mind will look for excuses. You may tell yourself that price will come back, the stop was too tight, or the market is only sweeping liquidity before the real move.
Sometimes that may be true, but this is exactly why rules must be clear before the trade starts. A simple monk mode trading rule can look like this: if price reaches my invalidation level, I close the trade. No debate. No moving the stop. No “one more candle.” The decision was already made before the emotion arrived.
This is why “if-then” rules work well in trading. If the setup appears, then I enter. If the stop is hit, then I close. If I take two losses, then I stop for the day. The rule removes space for emotional negotiation.
🟠 Train Yourself To Accept Losses
One of the hardest parts of trading is admitting that the trade failed. Many traders do not lose because their entries are terrible. They lose because they cannot accept the loss when the trade is clearly wrong.
This is where daily discipline connects directly to trading psychology. Every time you do something you do not feel like doing, you practice control. Every time you finish the hard task, you prove that feelings do not need to lead the decision.
Closing a losing trade is the same kind of moment. Your ego does not like it. Your brain wants relief. You want the chart to prove you right. But the rule is clear: if the trade is invalid, the trade is over.
A small planned loss is normal. A loss that you keep holding because you cannot accept being wrong is dangerous.
🟠 Remove Easy Distractions
Monk mode also means reducing the things that make you weak before you even trade. If your morning starts with social media, random signals, group chats, and other people’s profit screenshots, your mind is already noisy before the chart opens.
A trader needs a clean environment. That does not mean living like a robot. It means setting simple limits. No random trade ideas before your own analysis. No entering because someone posted a chart. No watching five markets if you can only focus on one or two properly.
The fewer distractions you allow, the easier it becomes to follow your own rules. A clean mind will not make every trade win, but it gives you a better chance to act properly when pressure appears.
🟠 Keep The Rules Simple
Monk mode should not become complicated. If the routine is too hard, most people quit. The rules should be easy enough to repeat and strong enough to shape your behavior. A simple trader monk mode can be: wake up on time, train your body, read or study daily, write your trading plan before entering, risk small, close invalid trades, and stop trading when your rules say the day is done.
The point is not to suffer. The point is to build proof that you can lead yourself. Trading rewards the person who can follow a boring rule when emotions want something else.
🟠 Final Take
Monk mode for traders is about practicing discipline every day. Do hard things in normal life, and it becomes easier to do hard things on the chart.
Close the loser. Follow the stop. Wait for the setup. Respect the rule.
Swallow Academy

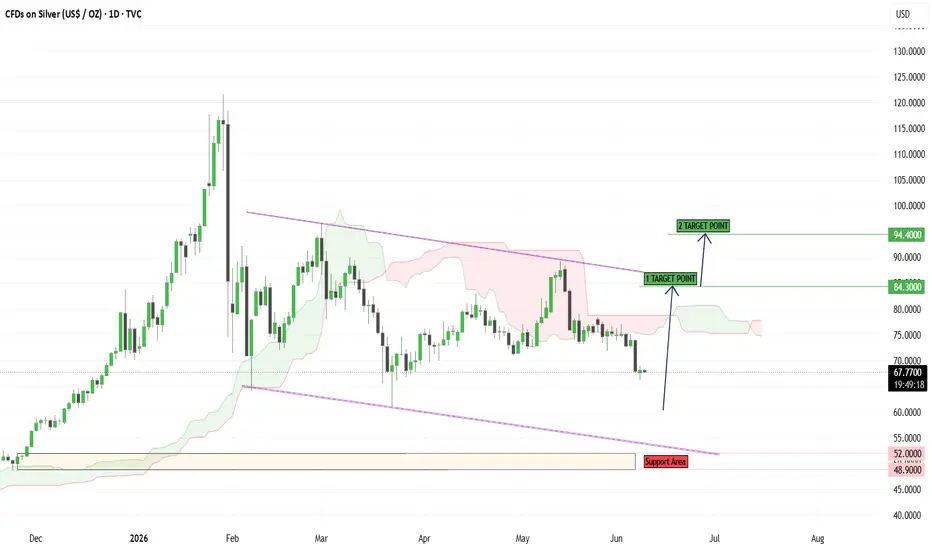
SILVER – Bullish Recovery From Major Support📊 SILVER – Bullish Recovery From Major Support
🔍 Market Overview
Silver is showing signs of stabilization after reacting strongly from a long-term support zone. Price remains near the lower boundary of a broad descending channel, where buyers are attempting to regain momentum following an extended correction.
The recent defense of support suggests that downside pressure may be fading, while a recovery above cloud resistance could trigger a stronger bullish expansion.
📈 Market Structure Analysis
* Market Bias: Bullish Recovery
* Momentum: Gradually Improving
* Current Phase: Support Rebound & Potential Breakout
As long as Silver continues holding above the major support region, buyers maintain the opportunity to push prices toward higher resistance levels.
🚀 Trading Scenarios
✅ Bullish Scenario (Preferred Setup)
Conditions: • Price remains above support structure
* Buyers continue defending pullbacks
* Breakout above cloud resistance confirms strength
Trade Strategy: Look for buying opportunities on retracements into support or after a confirmed breakout above resistance.
🎯 Target 1: 84.30
🎯 Target 2: 94.40
❌ Bearish Invalidation Scenario
Conditions: • Strong breakdown below support area
* Failure to maintain recovery structure
* Increased selling pressure beneath channel support
Trade Strategy: A decisive break below support could expose lower price levels and invalidate the bullish outlook.
🎯 Support Zone: 52.00 – 48.90
📍 Key Levels to Monitor
🟢 Immediate Support: 52.00
🟢 Major Support: 48.90
🔴 Resistance Target 1: 84.30
🔴 Resistance Target 2: 94.40
⚠️ Trading Perspective
Silver appears to be building a recovery structure after defending a significant support region. Sustained buying pressure and a breakout above nearby resistance could open the path toward the projected upside targets.
🧠 Professional Insight
The current setup reflects a potential bullish reversal supported by:
* Strong reaction from major support
* Descending channel support hold
* Improving price structure
* Cloud resistance nearing breakout point
* Favorable risk-to-reward profile
The highest-probability entries often emerge after confirmation of strength rather than anticipating the breakout too early.
🛡️ Risk Management
* Risk only 1–2% per trade
* Place stop loss below key support levels
* Wait for confirmation before entering
* Avoid excessive leverage during volatility
* Secure profits progressively as targets are approached
#Silver #XAGUSD #PreciousMetals #TechnicalAnalysis #BullishSetup #PriceAction #TradingView #MarketAnalysis #RiskManagement #TradingPlan 📈🔥
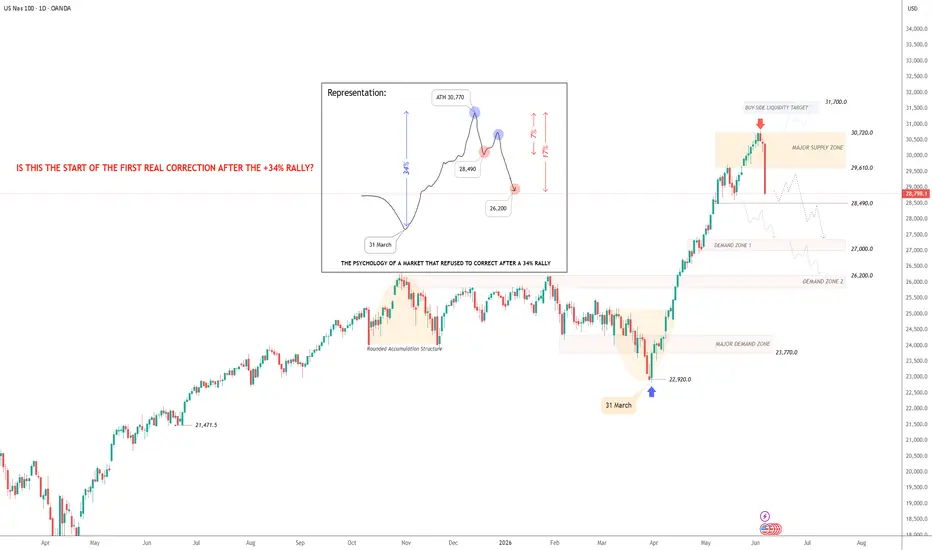
USNAS100 | PSYCHOLOGY BEHIND A 34% RALLY WITHOUT CORRECTIONUSNAS100 | THE PSYCHOLOGY OF A MARKET THAT REFUSED TO CORRECT FOR 34%
1. Introduction
Since the March 31st low near 22,920, the Nasdaq has experienced an extraordinary rally, climbing approximately 34% and reaching a new all-time high around 30,770.
What's fascinating about this move is not the gain itself.
It's the fact that the market achieved this advance without experiencing a meaningful correction.
For more than two months, every dip was bought, every pullback was viewed as an opportunity, and every bearish signal was quickly absorbed by aggressive buying pressure.
As traders, we often focus on price action and technical levels.
But sometimes the most important thing to analyze is market psychology.
And right now, Nasdaq may be entering one of the most important psychological phases of its entire rally.
2. Why Markets Need Corrections
• One of the biggest misconceptions among traders is that a correction is something negative.
In reality, corrections are a natural and necessary component of every healthy trend.
• Without corrections, markets become crowded.
• Late buyers continue entering positions at increasingly higher prices.
• Profits become concentrated among early participants.
• Risk perception disappears.
• Eventually, the market reaches a point where there are simply fewer buyers left to push prices higher.
• This is often when the first meaningful correction begins.
• Not because the trend is weak.
• But because the trend became too strong for too long.
3. The Problem With Vertical Rallies
• The Nasdaq rally from 22,920 to 30,770 resembles what traders often call a "one-sided market."
• Throughout the rally, sellers repeatedly attempted to regain control.
• Yet each attempt failed.
• As a result, market participants gradually became conditioned to believe that every decline would immediately recover.
• This creates a dangerous psychological environment.
• The longer a market refuses to correct, the more investors begin to believe that it cannot correct.
• History repeatedly shows that this is often when risk becomes greatest.
• Not at the bottom.
• But near the top.
4. Has Sentiment Started To Change?
Friday's sharp decline may represent the first meaningful challenge to bullish confidence since the rally began.
For the first time in weeks, sellers managed to create a significant rejection from all-time highs.
While one bearish session alone does not confirm a major trend reversal, it does introduce something that has been missing for months:
• Uncertainty.
• And uncertainty is often the first ingredient of a correction phase.
The market is beginning to ask a question it has not needed to ask for a long time:
• "What if the next dip is not immediately bought?"
5. How Deep Could The Correction Be?
Not all corrections are equal.
Historically, strong bull markets often experience several types of pullbacks before the broader trend resumes.
Tier 1: Minor Pullback (-3% to -5%)
• This is the most common scenario and usually represents profit-taking after an extended rally.
• A correction of this size would place Nasdaq near the 28,490 demand zone, allowing the market to cool down while maintaining a strong bullish structure.
Tier 2: Standard Retest (-7% to -10%)
• This type of correction typically occurs when investors begin reducing risk exposure after a prolonged advance.
• Such a move would bring price toward the 27,000 demand zone, where buyers may attempt to rebuild momentum.
Tier 3: The Flush (-12% to -15%)
• This is the scenario that most traders do not expect during a bull market.
• Flush corrections often occur when market participants become overly confident after a long rally and positioning becomes crowded.
• A decline of this magnitude could drive the Nasdaq toward the 26,200 major demand zone, where long-term buyers may begin accumulating again.
CORRECTION SCENARIOS
Tier 1: Minor Pullback
(-3% to -5%)
Target: 28,490
Tier 2: Standard Retest
(-7% to -10%)
Target: 27,000
Tier 3: The Flush
(-12% to -15%)
Target: 26,200
6. Technical Structure
The rejection occurred directly from the major supply zone between 29,610 and 30,720.
This area has now become the most important resistance region on the chart.
As long as the index remains below this zone, the probability of additional downside pressure remains elevated.
The first significant demand area can be found near 28,490.
A break below this level would likely increase the probability of a deeper correction toward 27,000.
If selling pressure accelerates further, the market could eventually seek liquidity within the major demand zone around 26,200.
From a broader perspective, even a decline toward 26,200 would still represent a normal correction within the larger bullish structure that began from the March low.
7. Final Thoughts
• The most interesting question facing Nasdaq traders today is not whether the market can reach another all-time high.
• Eventually, it probably can.
• The more important question is whether the market first needs to reset expectations after a historic 34% advance.
• Strong trends require strong corrections.
• The longer a correction is delayed, the more significant it often becomes once it finally arrives.
• After months of relentless buying, Friday's selloff may be the market's first signal that a long-awaited rebalancing phase has begun.
• The coming weeks will reveal whether this is merely profit-taking—or the beginning of the first real correction after one of the strongest rallies of the year.
Sincerely, Srosh Mayi
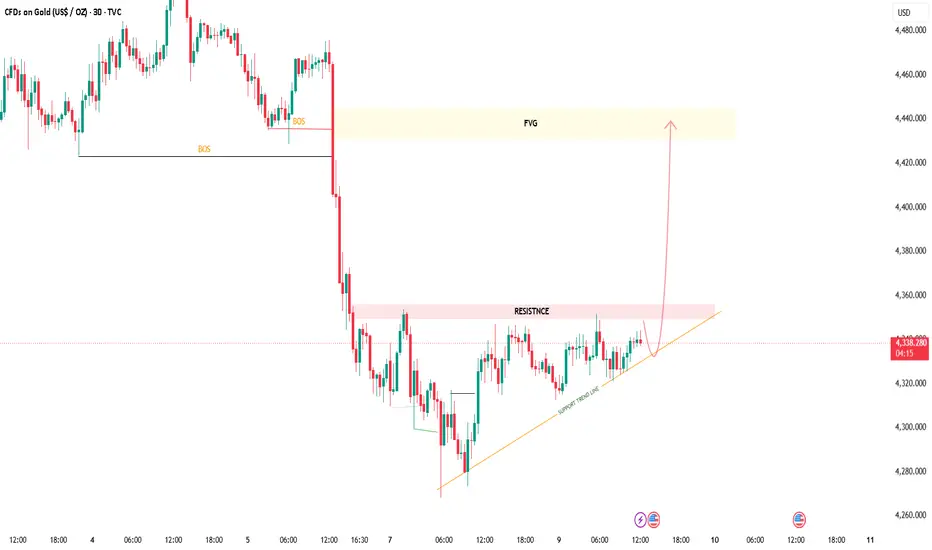
XAUUSD Resistance Break OpportunityGold is forming higher lows while respecting an ascending support trendline, showing improving bullish momentum. Price is currently testing a key resistance zone after recovering from recent lows.
A confirmed breakout above resistance could open the path toward the highlighted FVG area. The bullish outlook remains valid while price continues to hold above trendline support.
Support Trendline: Active
Immediate Support: 4,320 – 4,330
Resistance Zone: 4,345 – 4,350
Breakout Confirmation: Above 4,350
FVG Target Zone: 4,435 – 4,445
Invalidation: Below trendline support
FUNDAMENTAL VIEW:
Gold remains sensitive to USD strength and interest rate expectations
Safe-haven demand could support upside momentum
Market participants remain focused on upcoming economic data releases
Increased volatility may occur around major news events
BIAS:
Bullish above trendline support
Gold is trading within a developing bullish structure, supported by a rising trendline and consistent higher lows. Price is currently approaching a key resistance zone where a breakout could strengthen bullish momentum.
A sustained move above resistance may lead to a continuation toward the marked FVG target area, while holding above trendline support keeps the bullish scenario intact.
ETH deadLet’s move on to Ethereum.
In our previous analysis shared on this page, when Ethereum was trading around $2,800, we outlined a bearish scenario targeting the $1,800 region. That move has now largely played out as expected, and the market appears to be entering a consolidation phase before its next major directional move.
From a technical perspective, the current structure suggests that Ethereum could continue working its way toward the lower boundary of its multi-year trading range, with the $1,000–$1,200 area remaining a key zone of interest.
It is important to understand that this is a market outlook, not a prediction. However, if price eventually reaches that region, it could represent one of the most attractive long-term accumulation zones of the cycle.
Should such a scenario develop, investors may consider a disciplined DCA (Dollar Cost Averaging) approach rather than attempting to time an exact bottom. Historically, periods of extreme pessimism have often created opportunities for the next major expansion phase.
The coming months could be critical for Ethereum’s long-term structure, and the reaction around these lower levels may provide valuable clues about the next cycle.
Follow the page to stay updated with future market insights and technical updates.

USOIL Breakout and Potential Retrace!Hey Traders, in today's trading session we are monitoring USOIL for a selling opportunity around 90.60 zone, USOIL was trading in an uptrend and successfully managed to break it out. Currently is in a correction phase in which it is approaching the retrace area at 90.60 support and resistance area.
Trade safe, Joe.

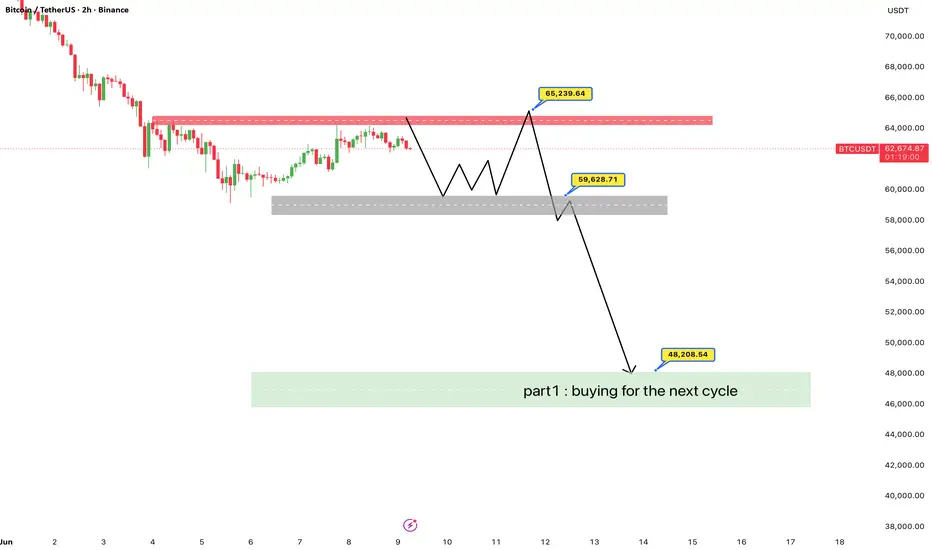
btc deadFollowing our last Bitcoin analysis, the scenario played out almost exactly as expected. We are now trading around the $64,000 region, and price is approaching what I consider the capitulation phase, which lies below the $59,000 level.
The question is: how will this unfold?
My expectation is that Bitcoin could remain trapped within the $60,000–$65,000 range for approximately two weeks before finally entering the capitulation zone. Once price breaks into the $59,000 area, we are likely to witness a series of sharp downside targets being hit in succession, potentially leading to an accelerated decline toward the $47,000 region.
For long-term buyers, preparation is key. I believe the optimal accumulation zone will be between $36,000 and $47,000, where scaling in through three separate entries could offer the best risk-to-reward opportunity.
It is also worth noting that, for the first time, Bitcoin may extend its correction significantly below the previous cycle's all-time high. This would represent a unique characteristic of the current cycle and a development that many market participants are not yet considering.
Just as we repeatedly emphasized during the rally that a traditional altseason was unlikely to occur, we are now highlighting another potential market dynamic that could define this cycle.
Follow the page for more real-time updates and detailed market insight
Bitcoin Breakdown Accelerates, $56K Now in the CrosshairsHI!
Bitcoin has suffered a decisive technical breakdown after losing both its ascending trendline support and the key weekly support zone around $60K. The sharp selloff confirms a major shift in market structure, with sellers firmly in control for the first time in months.
The recent rebound appears to be nothing more than a relief rally within a broader bearish trend. Price is now approaching a critical resistance zone near $64K–$66K, where any rejection could provide fresh downside momentum.
From a technical perspective, the market remains vulnerable as long as Bitcoin trades below the breakdown area.
👉🏼 Key Level to Watch:
A daily close above $66K would invalidate the immediate bearish scenario and suggest that buyers are regaining control.
🎯 Bearish Target:
If the current recovery fails, Bitcoin could continue its decline toward the $55K–$56K demand zone, which represents the next major area of interest for buyers.
With support broken, trend structure damaged, and resistance overhead, the path of least resistance remains to the downside until proven otherwise.
I’m excited to announce that I’m now a Brand Ambassador for AvaTrade!

BTC/USDT: Cyclical Market Structure & Liquidity AnalysisHello Traders
The current BTC/USDT price action reflects a distinct "Impulsive Move followed by Mean Reversion" cycle. The repetitive pattern observed on the chart suggests that the market is not just moving randomly, but is reacting to institutional liquidity trapped at specific price levels. Each aggressive buy-side move is being met with a sharp correction, indicating a classic "Liquidity Sweep" and distribution phase.
Key Technical Observations:
Cyclical Symmetry: The chart clearly highlights a recurring sequence where an impulsive rally is followed by a predictable sell-off. This suggests that "Smart Money" is using these rallies to exit positions and trap retail buyers.
Time-Interval Analysis: By observing the time-based intervals between these moves, we can identify a rhythm in the volatility. These repetitive spikes are often driven by structural imbalances (Fair Value Gaps) being filled before the next leg of the move.
Structural Resistance: Each attempt to reclaim the previous highs is being met with immediate selling pressure, confirming that the current supply zones are holding firm.
Trading Strategy:
Given the current structure, entering at the peaks of these moves carries a high risk.
Actionable Insight: The strategy should focus on "Sell on Strength" until a definitive volume-backed breakout above the established supply zone occurs.
Key Levels: Monitor the recent swing lows; these serve as the primary liquidity targets for the downside, while the resistance levels remain the areas to look for potential exhaustion.
Conclusion:
BTC/USDT is currently operating within a high-conviction range-bound structure. Until the asset breaks out of this "Impulse-Correction" cycle with significant volume, traders should prioritize risk management and look for entries near established support levels rather than chasing rallies.
Disclaimer: This analysis is for educational purposes only and does not constitute financial advice. Please ensure you practice proper risk management.
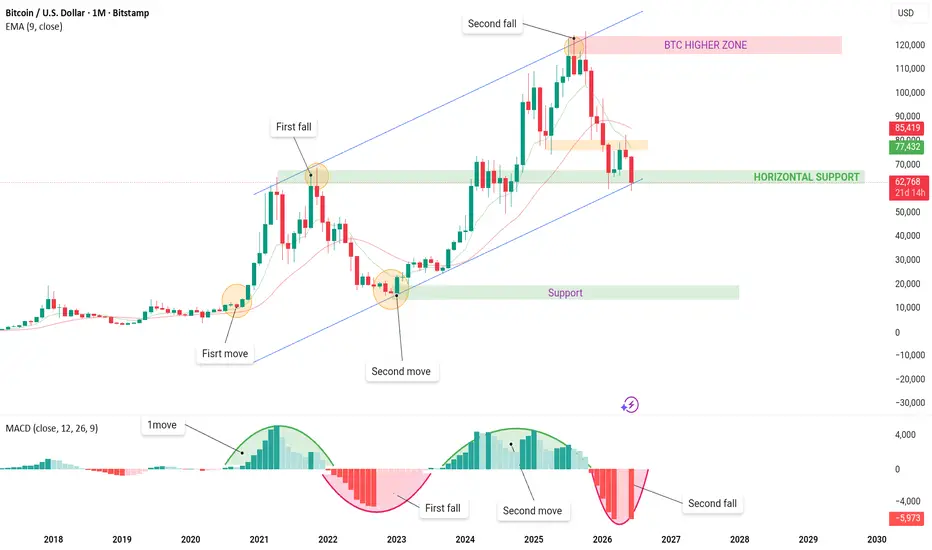
In this monthly BTC/USDT chart, we observe Bitcoin’s price action within a clear bullish channel. In two major cycles—first in 2021 and then in 2025—we saw significant falls. Each time, the price tested a critical horizontal support zone around 62,637 USD, with declining volume, indicating growing selling pressure. Should this support break, a larger decline toward approximately 20,000 USD could occur. Conversely, if this support is successfully retested and reclaimed, it could mark a new bullish phase. The MACD indicator, which we’ve applied, confirms these cycles by showing both buying and selling pressure, with the histogram currently in negative territory, signaling bearish momentum. Overall, we are at a pivotal juncture: a breakdown of this support could trigger a major bearish trend, while a successful retest might signal a new bullish revival.
BITCOIN That is historically the most optimal time buy window.Bitcoin (BTCUSD) broke below its 1W MA200 last week for the first time in 2.5 years and so far this weeks doesn't show signs of a strong recovery yet. That is because the market has already entered its most optimal buy time window historically.
That has been the zone starting from when the Vortex Indicator (VI) makes a Bearish Cross (red line crossing above blue) and is completed when it makes a Bullish Cross (blue line crossing above red).
Within this Time Zone, the safest entry level has historically been when BTC broke below the MVRV oversold band (light blue). That level is currently sitting marginally below $50000. Historically the market tends to break below this band twice, and on the last Cycle (2022), the 2nd touch was slightly lower, but again the safest way to secure a long-term buy position on BTC ahead of the 3-year Bull Cycle, would be the first breach of the oversold MVRV.
Do you think that a $50000 secures that long-term positioning? Feel free to let us know in the comments section below!
---
** Please LIKE 👍, FOLLOW ✅, SHARE 🙌 and COMMENT ✍ if you enjoy this idea! Also share your ideas and charts in the comments section below! This is best way to keep it relevant, support us, keep the content here free and allow the idea to reach as many people as possible. **
---
💸💸💸💸💸💸
👇 👇 👇 👇 👇 👇
