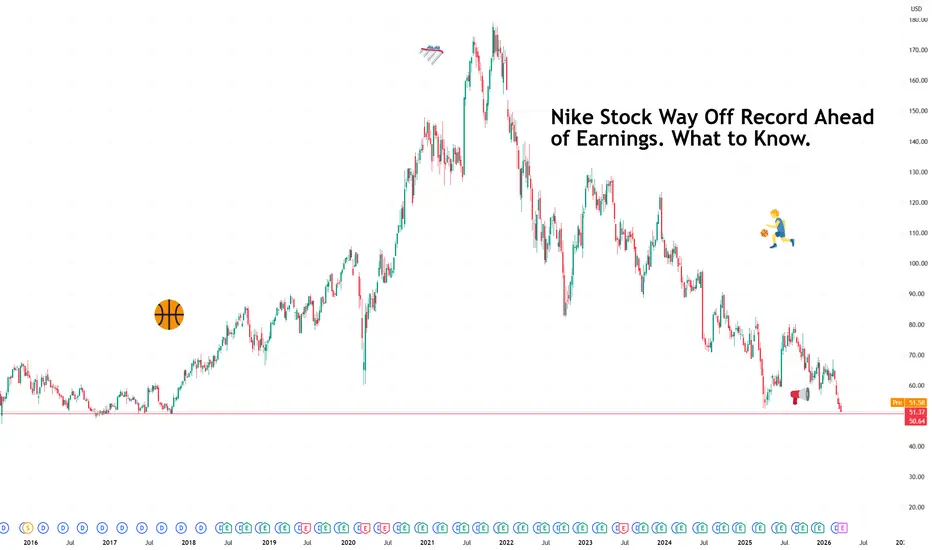
Nike Stock Way Off Record Ahead of Earnings. What to Know.There is a particular kind of corporate humbling that comes not from collapse but from irrelevance creeping in at the edges.
Nike NYSE:NKE is still the world's largest sportswear brand, still moving tens of billions in revenue, still on the feet of more athletes than any other company on earth.

The best trades require research, then commitment.
Get started for free$0 forever, no credit card needed

Scott "Kidd" PoteetPolaris Dawn astronaut

Where the world does markets
Join 100 million traders and investors taking the future into their own hands.
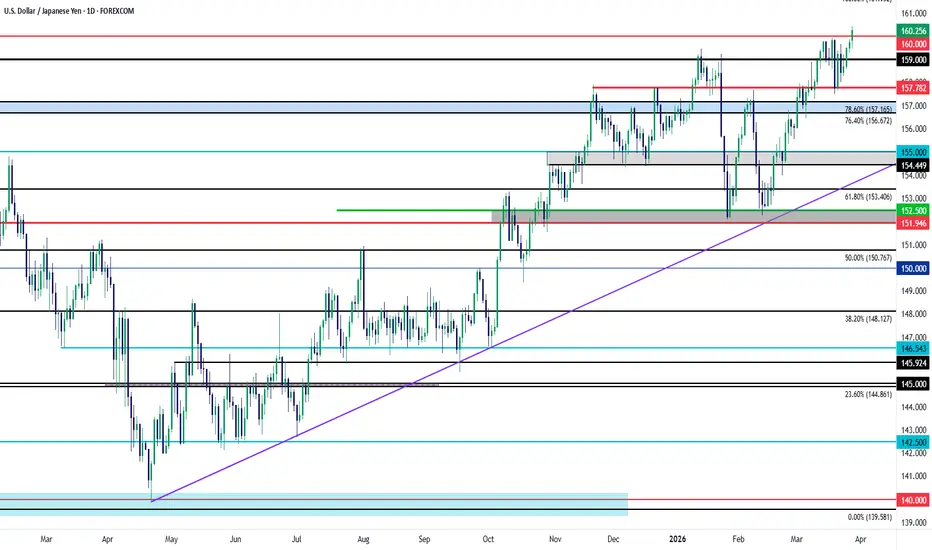
USD/JPY: The 160.00 TestFor the first time since July of 2024 USD/JPY has pushed above the 160.00 handle.
The move hit around 1am Tokyo time so we could still see a response from Japanese policymakers around the Sunday open, and interestingly, last week began with another threat of intervention that brought pullback to US
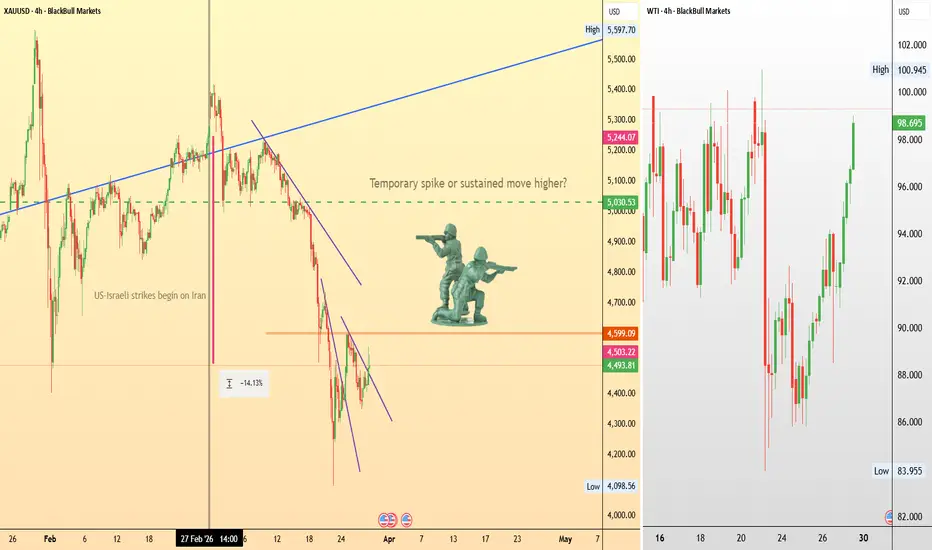
Will a ground invasion finally move gold?From a technical perspective, gold is currently in a clear short-term downtrend following the initial geopolitical spike. Gold appears to be waiting for a stronger catalyst.
Are ground troops what gold needs to start moving upward?
Iran has claimed it could mobilise more than 1 million troops to
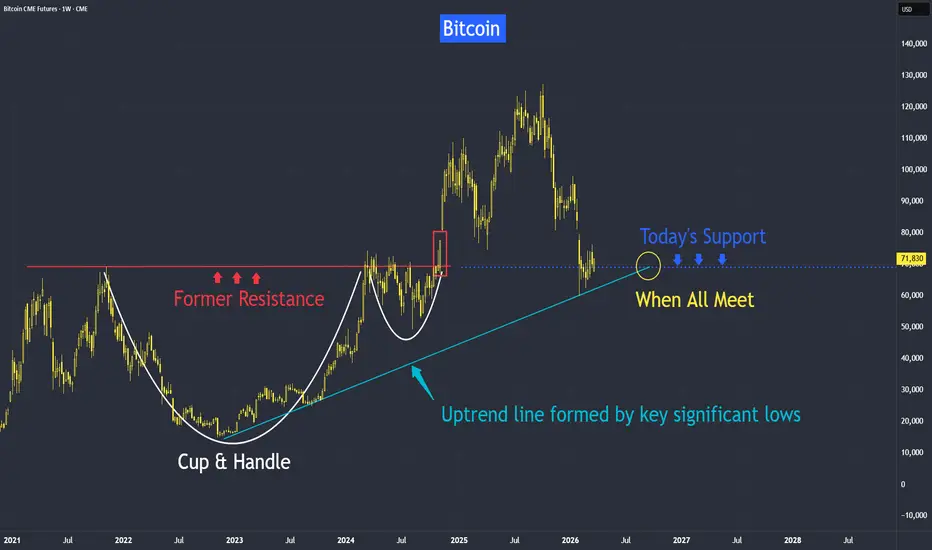
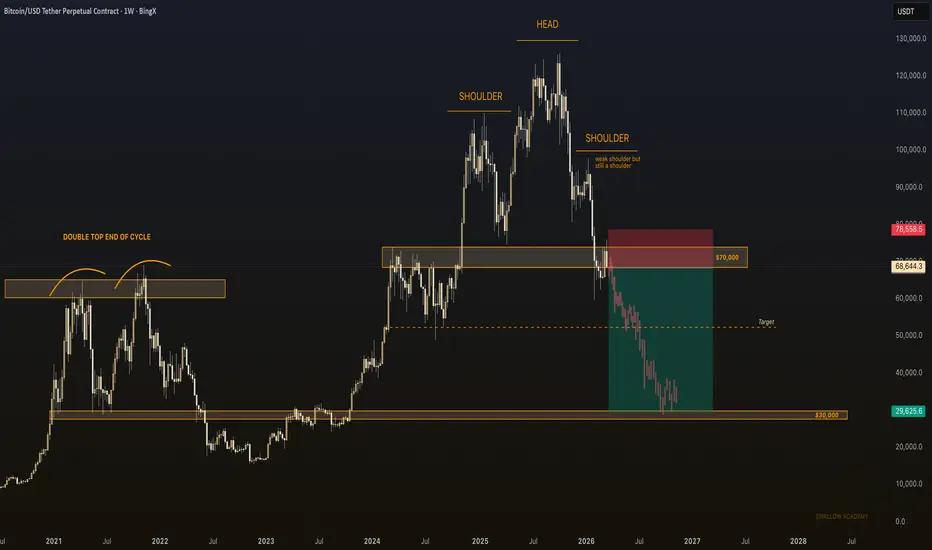
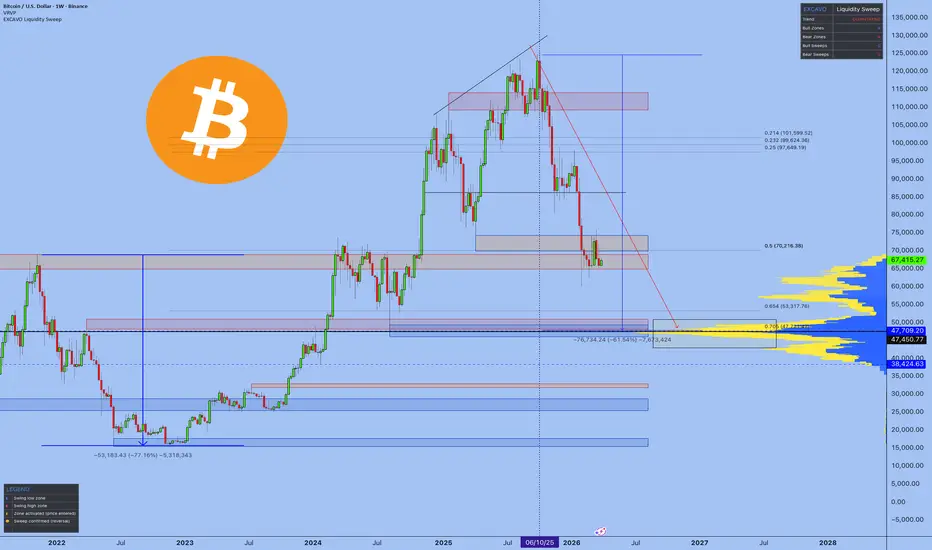
Bitcoin Key Support Level at 70,000It has fallen from last year's highs, but technical support could be near, and also supported by several fundamental factors.
Let me first touch on two key fundamentals before covering the technical aspects.
1) Regulator creating a friendlier environment - with new SEC rules and upcoming legislati
Silver Analysis: Which Direction Is Next?Before anything else, it’s important to note that silver, unlike gold, tends to have sharp and aggressive corrective moves. This makes it a bit more challenging to trade, so proper risk management and caution are essential when dealing with it.
From the point where we placed the red arrow on the ch

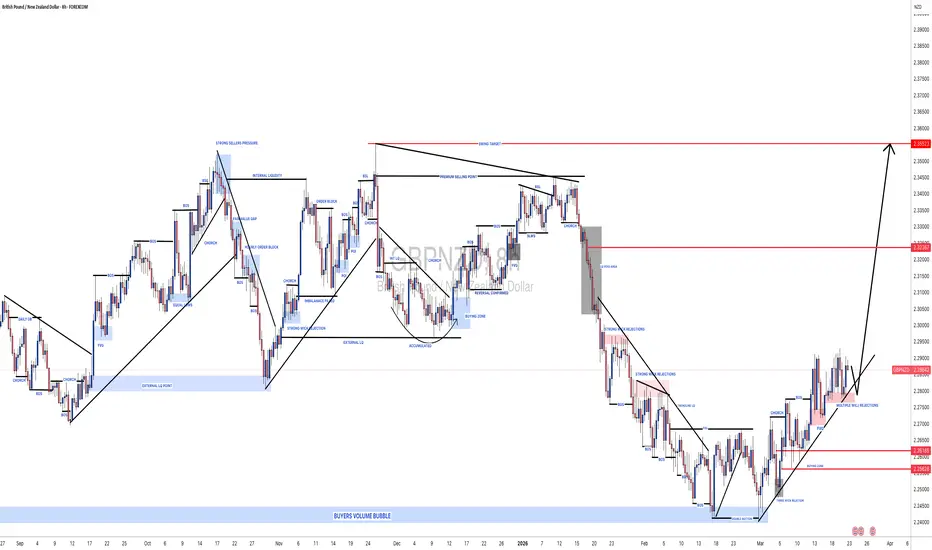
#GBPNZD: Two Targets, Once Strong Bullish Entry! ✴️ The GBP/NZD pair demonstrated a favourable reversal upon reaching our designated buying zone at 2.256, currently trading at 2.287. This indicates potential for continued upward momentum. We anticipate the price may advance towards the 2.32 level where a liquidity void is expected to be addressed.
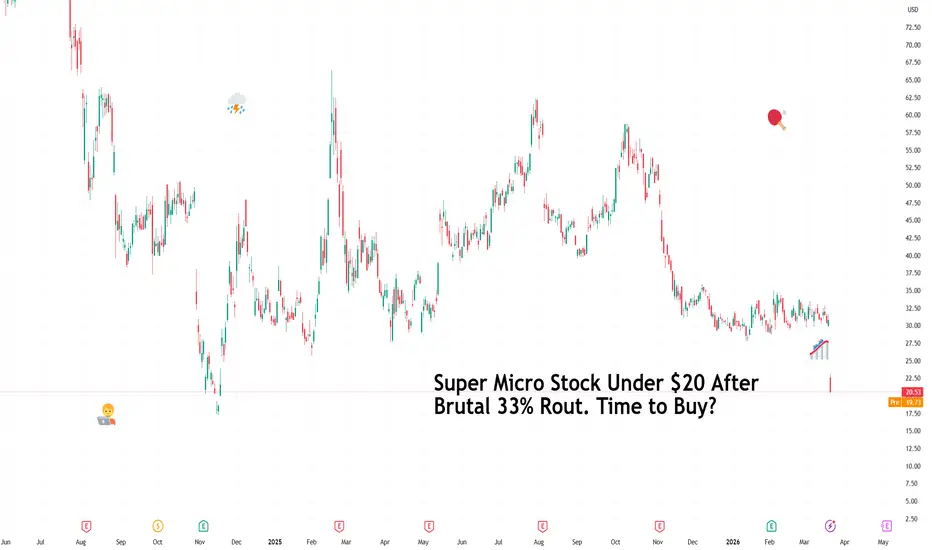
Super Micro Stock Under $20 After Brutal 33% Rout. Time to Buy?If only there was a way to track where things went wrong.
The board of directors at Super Micro NASDAQ:SMCI got together one day in the boardroom and decided it’s a good idea to bring back the same executive who had already resigned once over an accounting scandal.
They voted to hire him as a
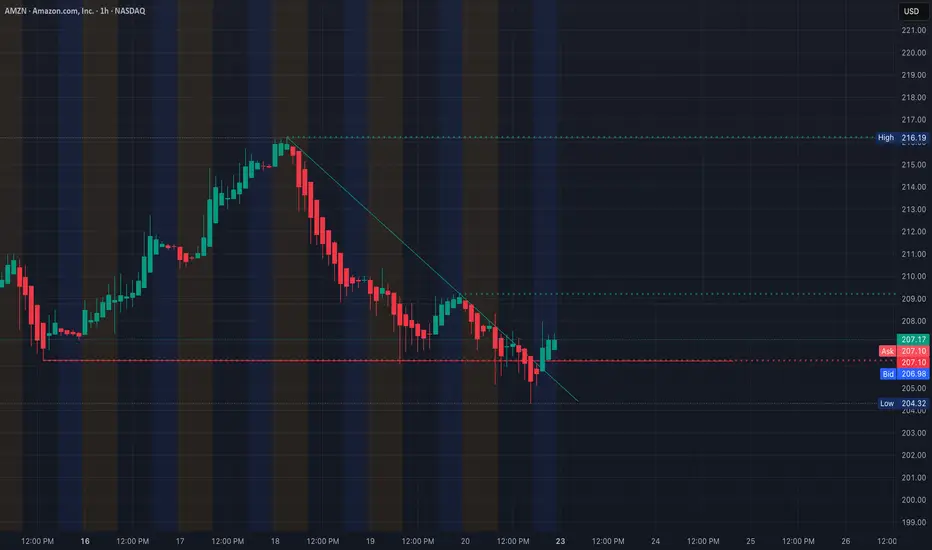
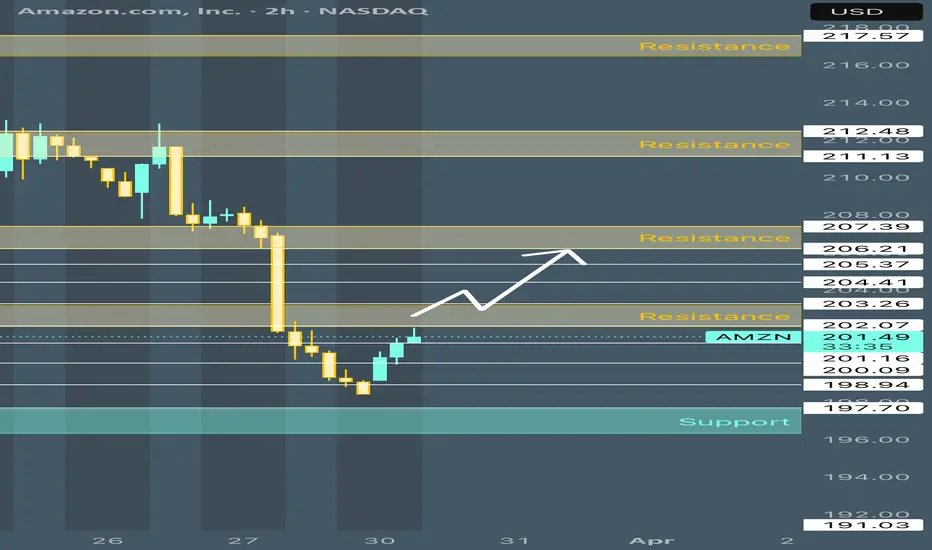
AMZN Holding Range - Waiting for Direction. Mar. 23Looking at AMZN right now, price is coming off a selloff but starting to stabilize around the 205–207 area.
This looks like a base forming, but it’s still sitting right under a key resistance zone.
1H Structure - Downtrend Trying to Slow
On the 1H chart, AMZN has been trending lower with consistent
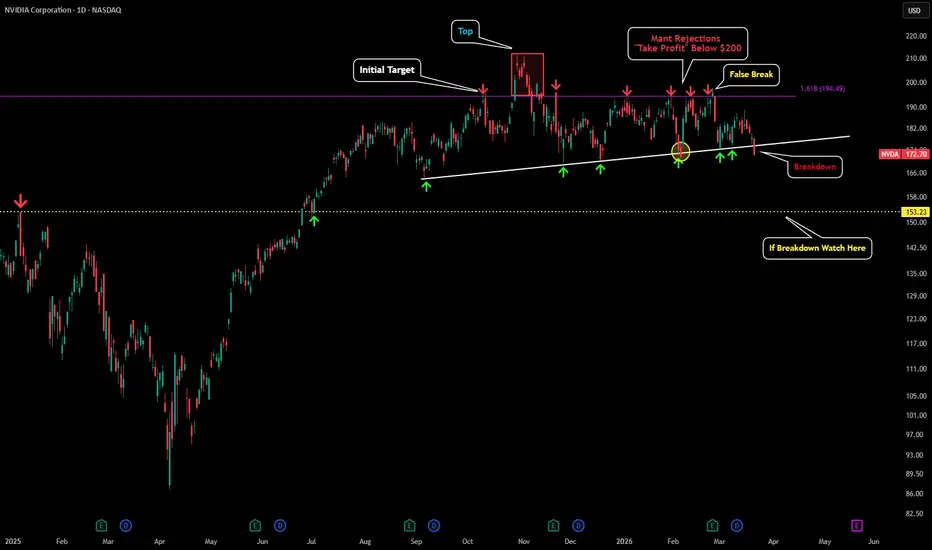
NVDA - On Verge of Breakdown This is an update to my last post:
I have been monitoring this trendline for quite some time, and with Friday's close, NVDA has broken below a trendline it has been holding for the past six to seven months which is a significant development.
It is possible for NVDA to reclaim this trendline on Mo
Bitcoin | We Are Officially In Bear MarketThe structure of Bitcoin is telling us just one thing: we are going to keep moving to lower zones from here on; we are in a bear phase of the markets.
Now saying that we are in bear markets is a little extreme, some might say but let's face the facts here: this bull market we had was never suppose
See all editors' picks ideas
Swing Structure Forecast [BOSWaves]Swing Structure Forecast - Statistical Swing Projection System with Volatility-Adaptive Support and Resistance Detection
Overview
Swing Structure Forecast is a statistically-driven swing analysis system that maps directional price structure through confirmed pivot identification, where supp
Pine Script® indicator

TASC 2026.04 A Synthetic Oscillator█ Overview
This script implements a Synthetic Oscillator as presented by John F. Ehlers in the April 2026 TASC Traders' Tips article "Avoiding Whipsaw Trades". The indicator aims to provide a smooth, low-lag oscillator for timely trading signals by dynamically mapping a sine wave to price data
Pine Script® indicator

Volume Spread Analysis IQ [TradingIQ]Hello Traders!
🔹Volume Spread Analysis IQ
This indicator was most voted on for our indicator competition - so here it is! Hope you guys like it :D
Volume Spread Analysis IQ is a chart-reading tool built to help traders judge effort, result, and background context in a way that is visual and
Pine Script® indicator

Market Microstructure AnalyticsThe Hidden Toll on Every Trade
Every time you buy or sell a financial instrument, you pay a cost that never appears on your brokerage statement. It is not a commission. It is not a fee. It is the spread between the price at which someone is willing to sell to you and the price at which someone is
Pine Script® indicator

Fair Value Gap Profile + Rolling POC [BigBeluga]🔵 OVERVIEW
FVG Profile builds a price-level profile based on detected Fair Value Gaps (FVGs) over a fixed lookback period.
Instead of measuring traded volume alone, this tool aggregates bullish and bearish FVG occurrences into horizontal bins, allowing traders to see where price inefficienci
Pine Script® indicator

PineScript integration with Notepad++ (UDL)THIS IS NOT AN INDICATOR!
This is PineScript integration with Notepad++ text editor (NPP). It supports PineScript v6 as of January 2026. Provides autocompletion, function list and syntax highlighting for *.pine files.
Why would anyone need this?
Pine Editor doesn't provide function list yet
Pi
Pine Script® indicator

Machine Learning Pivot Points (KNN) [SS]Hey everyone,
Been working on this one for a very long time.
1. What It Is: The Geometric DNA of a Pivot
Machine Learning Pivot Points (KNN) is a predictive structural tool that moves away from traditional lag based oscillators. Instead of waiting for a moving average crossover, this system t
Pine Script® indicator

Market Structure Volume Profiles [Kioseff Trading]Hello traders and friends!
Introducing: "Market Structure Volume Profiles".
This script combines market structure with volume profiling and CVD to show how volume develops inside each structural changes of the market.
Instead of building one continuous profile across a session, this script create
Pine Script® indicator

Liquidity Thermal Map [BigBeluga]🔵 OVERVIEW
Liquidity Thermal Map visualizes where the highest traded volume has accumulated across price levels over a fixed lookback period.
Instead of plotting classic volume profiles with bars, the indicator builds a horizontal thermal heatmap directly on the chart, highlighting areas of
Pine Script® indicator

VIX Curve Pro - Real-Time Term Structure with StatisticsThis indicator displays the VIX term structure as a spatial curve directly on the chart, allowing you to instantly identify whether the volatility market is in contango or backwardation.
It shows the relationship between different VIX maturities (9D, 30D, 3M, 6M, 1Y) as a single curve.
It also sh
Pine Script® indicator

See all indicators and strategies
Community trends
Nike Stock Way Off Record Ahead of Earnings. What to Know.There is a particular kind of corporate humbling that comes not from collapse but from irrelevance creeping in at the edges.
Nike NYSE:NKE is still the world's largest sportswear brand, still moving tens of billions in revenue, still on the feet of more athletes than any other company on earth.
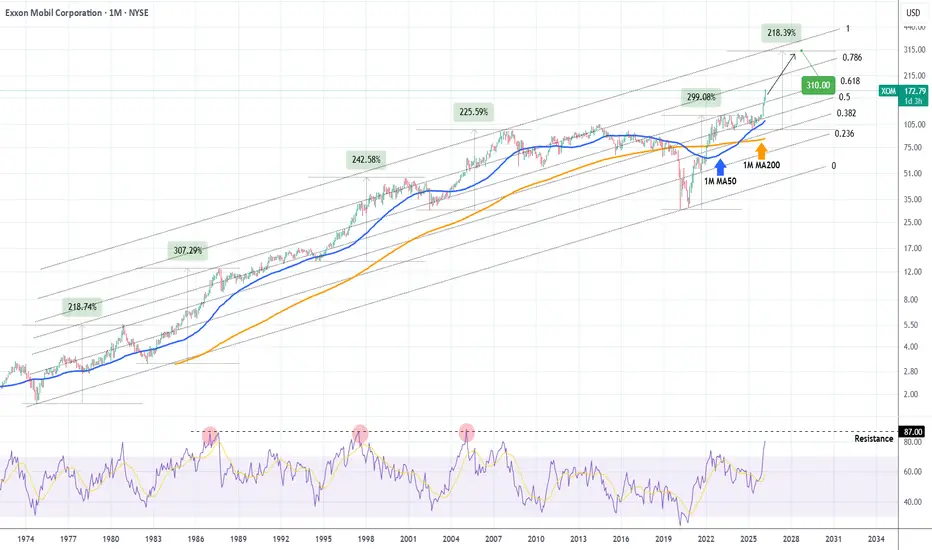
EXXON MOBIL can almost double within 3 years.Exxon Mobil (XOM) has started a new Bull Cycle, one sequence that is recurring within its 58-year trading history. Helped to a large extent by the current geopolitics (U.S. - Iran war), the price is extending this month a rally that started after the April 2025 Low on the 1M MA50 (blue trend-line).
Possible AMZN setups**PLAY OF THE DAY**
**AMZN**
Watching for two different scenarios here depending on what we see across the markets as a whole. Both setups looks like they have great potential to finally get us back on track with some great options trades this week!
**SHORT SETUP**
**ENTRY** - 202-202.75
**SL**
Banks Are Sending a Signal — $JPM at a Key Decision LevelBanks tend to move first when liquidity conditions shift, and right now JPMorgan Chase is sitting at a level that could determine the next directional move for the sector.
With uncertainty around rate cuts and pressure in private credit, I’m watching this closely.
⸻
Technical Setup (The Strat + S


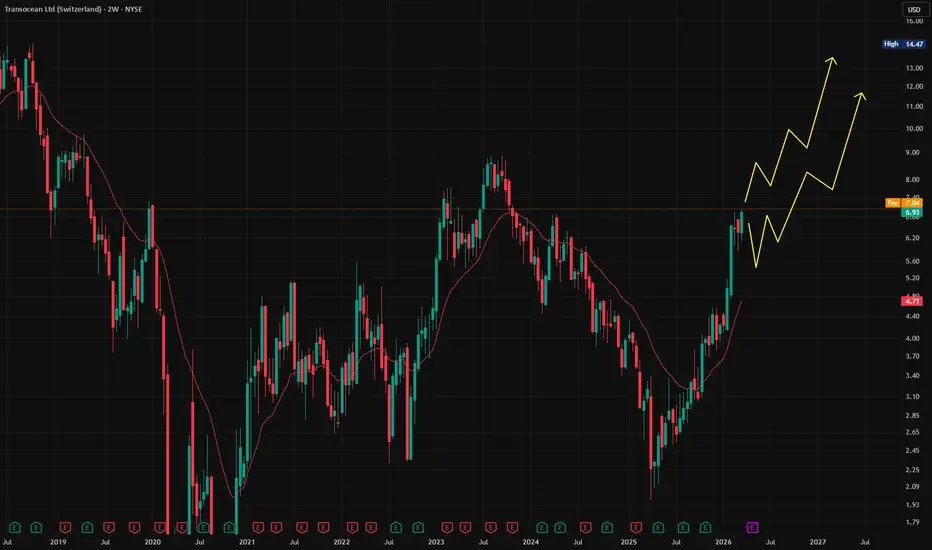
You might be surprised by what I’m about to say now. $RIG🚨 You might be surprised by what I’m about to say now.
A few weeks ago, I took a long position, and it’s already in solid profit.
Here’s the reasoning behind the trade.
The oil era is not ending, it is evolving.
ExxonMobil and OPEC now expect global oil demand to continue growing well beyond 203
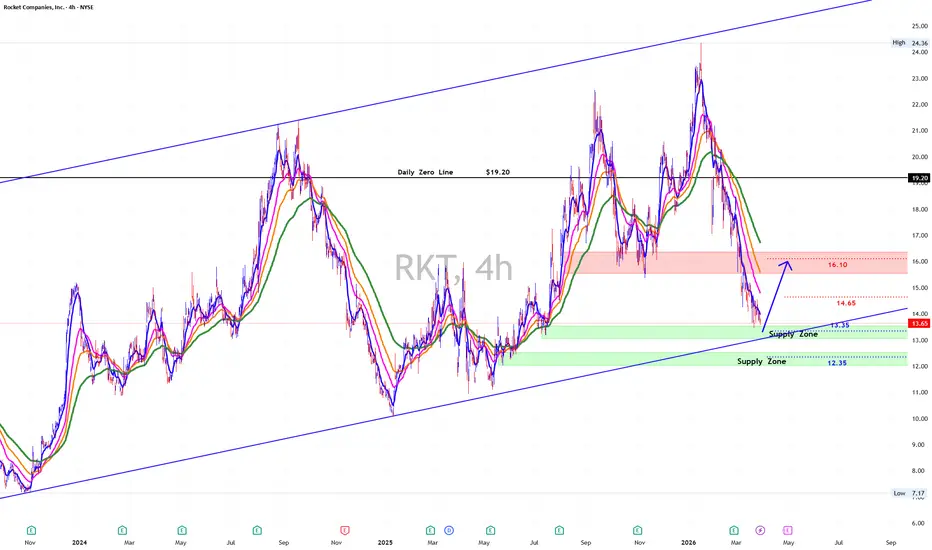
RKT: Is Set For A BounceEyes on RKT ladies and gentlemen . Is set up for a bounce.
Finally is coming to Papa. First buy order Now and 2nd 1/2 buy order at the 2nd supply zone
Play it right.................Play it safe.................Play it The Numberfive Way.
Boost...............Follow.................Share..........
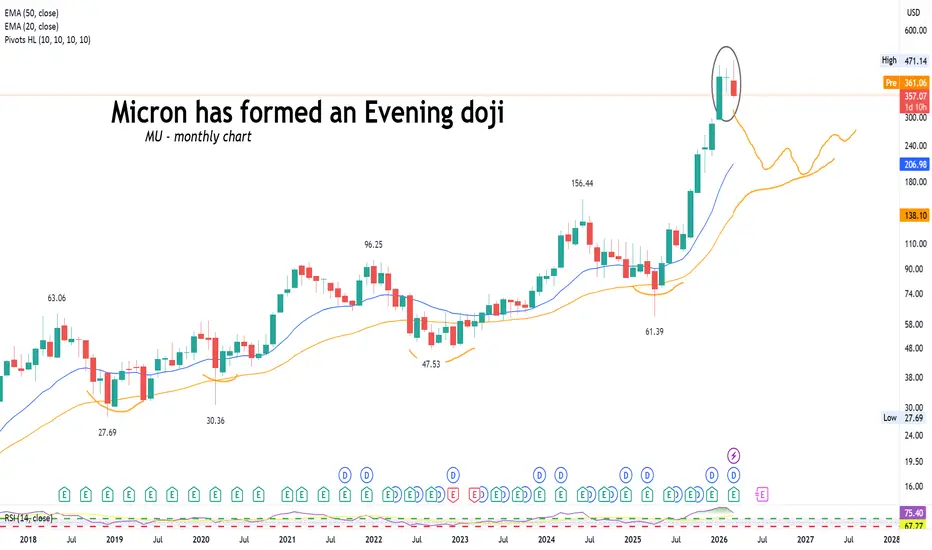
Has Micron just formed a top?!Micron has clearly formed an evening doji formation, which is a bearish formation signalling a top, turnaround.
This is a monthly chart you are looking at, which candle closes tomorrow, so most likely won't change that much.
I like to invest into stocks for long term or make swing trades, I am not
Week 14 of 52 — Even defensive stocks are breaking downWhile most traders are focused on high-beta names, something bigger is happening under the surface.
UnitedHealth Group — one of the strongest defensive stocks in the market — is breaking down.
This is not just a pullback.
This is a shift in confidence.
The Setup
When defensive stocks start losin

Micron Technology - Heading for another -50%!☠️Micron Technology ( NASDAQ:MU ) is perfectly following all structure:
🔎Analysis summary:
I remember literally everyone hating on me calling the top on Micron Technology. Yet just two weeks later, we are witnessing a harsh -30% correction. Looking at the higher timeframe this is just the beg

See all stocks ideas
Today
TET1 Energy Inc.
Actual
—
Estimate
−0.10
USD
Today
FDSFactSet Research Systems Inc.
Actual
—
Estimate
4.38
USD
Today
MKCMcCormick & Company, Incorporated
Actual
—
Estimate
0.60
USD
Today
JILLJ. Jill, Inc.
Actual
—
Estimate
−0.11
USD
Today
BOSCB.O.S. Better Online Solutions
Actual
—
Estimate
—
Today
PRPLPurple Innovation, Inc.
Actual
—
Estimate
−0.04
USD
Today
TERNTerns Pharmaceuticals, Inc.
Actual
—
Estimate
−0.28
USD
Today
AVXAvax One Technology Ltd.
Actual
—
Estimate
—
See more events
Community trends
You're Not Reading the Chart. You're Defending It.
Technical Analysis Doesn't Work. And Here's Why That's Your Mistake
The chart told you everything. You just didn't want to hear it.
That's not a market problem. That's a you problem - and it has a name.
Confirmation bias. Most people reading this are committing it right now. The ones who just
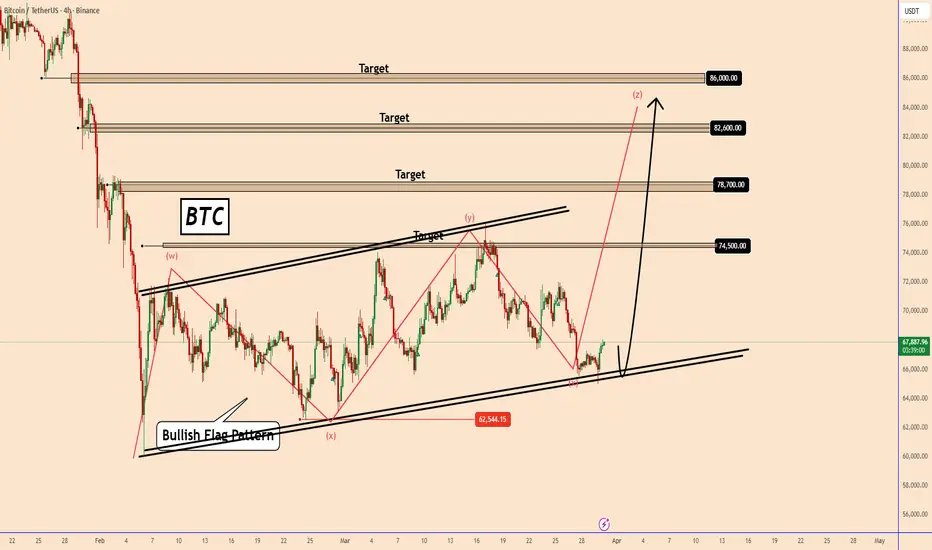
BTC: Another Attempt To Start The Bullish TrendBTC: Another Attempt To Start The Bullish Trend
The current setup we have for BTC is one that I have shared before and it only managed to hit the first target and enter a larger structural area.
Currently BTC is transformed more but looks like we can be in a very large WXYXZ movement. BTC is on t
BTCUSDT: Weak Structure Signals Move Toward 65.5KHello everyone, here is my breakdown of the current BTCUSDT setup.
Market Analysis
BTC is trading inside a triangle, with descending resistance and rising support. Price failed to hold above the 67,400 supply, confirming strong resistance.
Currently, price is trading below resistance and approac

BTCUSDT Short: Weak Demand Signals Liquidity Sweep to 66KHello traders! Here’s my technical outlook based on the current BTCUSDT (4H) chart structure. BTC previously traded inside a range, after formed a rising trend line. The market faced rejection from a pivot high under a descending supply line, BTC broke below the trend line and the 68,400 supply zone

BTCUSDTHello Traders! 👋
What are your thoughts on Bitcoin?
Bitcoin has formed a clear descending channel after consistently printing lower highs and lower lows. However, over the past two months, price has been consolidating within a trading range, moving sideways without a clear directional trend. Curre

Ethereum formed a fake bearish H&S, creating a bear trapBased on the bullish CH on the chart and the formation of higher lows, the structure is bullish on the hourly timeframes.
The market maker has created a wide ranging zone to hunt liquidity. With each drop, it gives traders the impression that sellers have stepped in, but the structure remains bulli

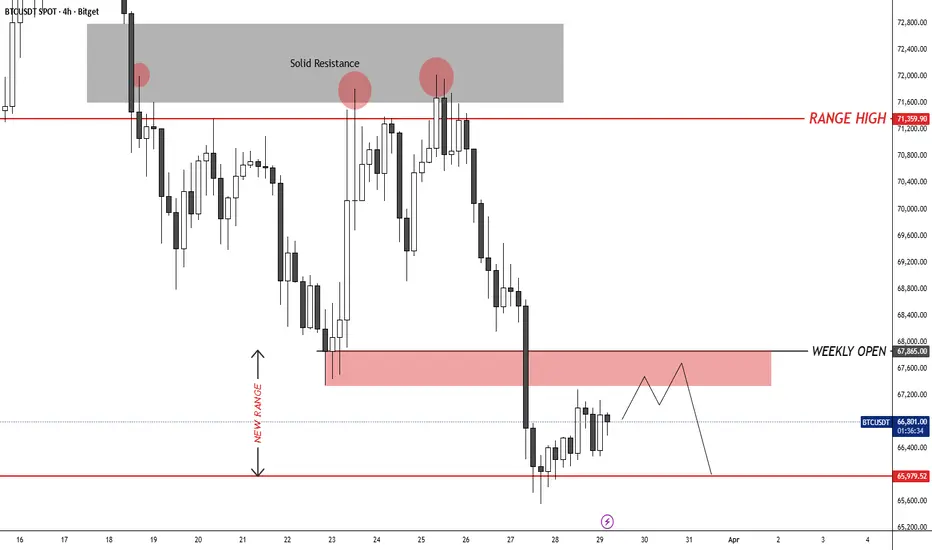
BTCUSDT – 4H Outlook: New Consolidation RangeHello traders,
Bitcoin is showing signs of structural weakness after failing to hold the Weekly Open. This rejection suggests the market is entering a "New Range" phase, with the potential for a deeper correction if bulls can't reclaim key pivots
💡Trade Sentiment
The close below the Weekly Open is
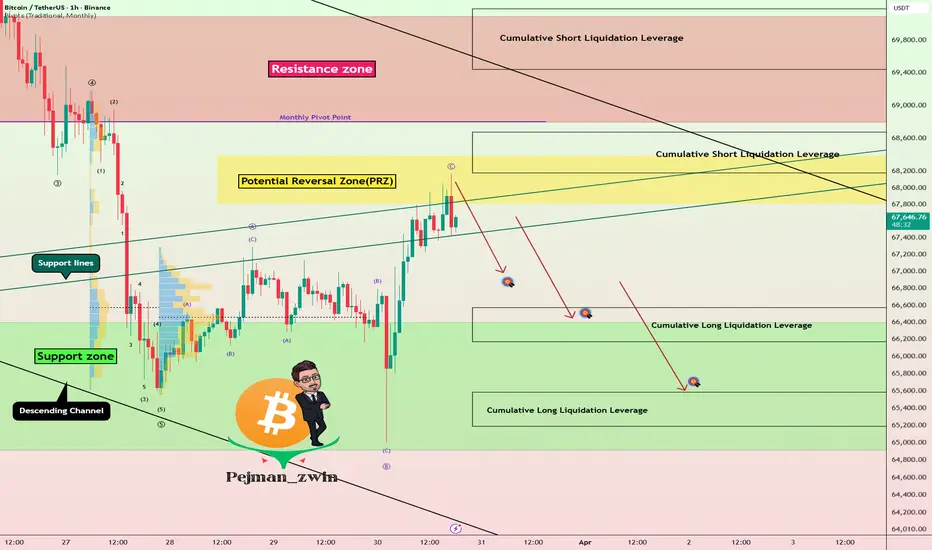
Bitcoin Reached the PRZ | Now the Reaction Matters MostAs I expected in the previous idea , Bitcoin ( BINANCE:BTCUSDT ) started rising from the support zone($66,400-$64,900) and reached all of its targets (full target).
Currently, Bitcoin is moving near the potential reversal zone (PRZ) and the Cumulative Short Liquidation Leverage ($68,670-$68,180
Bitcoin showing strong market structureBitcoin is currently showing strong market structure after holding key support zones and maintaining higher price levels. The recent price action suggests that BTC is not weak — instead, it is building momentum for a potential bullish continuation.
Bitcoin correction phase, Bitcoin is consolidating

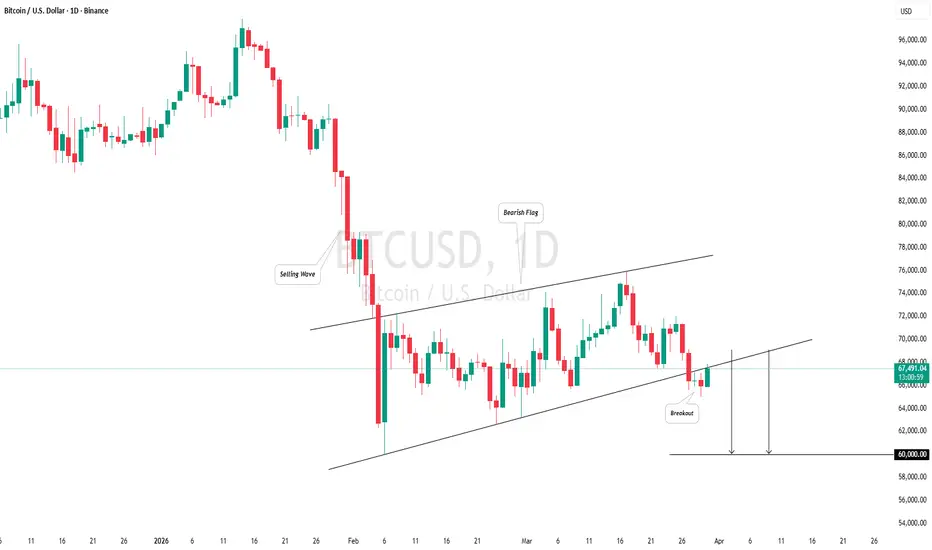
BITCOIN (BTC/USD): Classic Trend-Following PatternI see a significant bearish pattern on 📉BITCOIN a daily timeframe.
The price formed a bearish flag.
Trading in a bearish trend, the violation of a support of the flag is a strong
trend-following signal.
Consequently, we might anticipate a downward movement towards the 60,000 level.
See all crypto ideas
Gold 30Min Engaged ( Bearish Entry Detected )⚡Base : Hanzo Trading Alpha Algorithm
The algorithm calculates volatility displacement vs liquidity recovery, identifying where probability meets imbalance.
It trades only where precision, volume, and manipulation intersect —only logic.
✈️ Technical Reasons
/ Direction — SHORT / Reversal 4570
☄️B

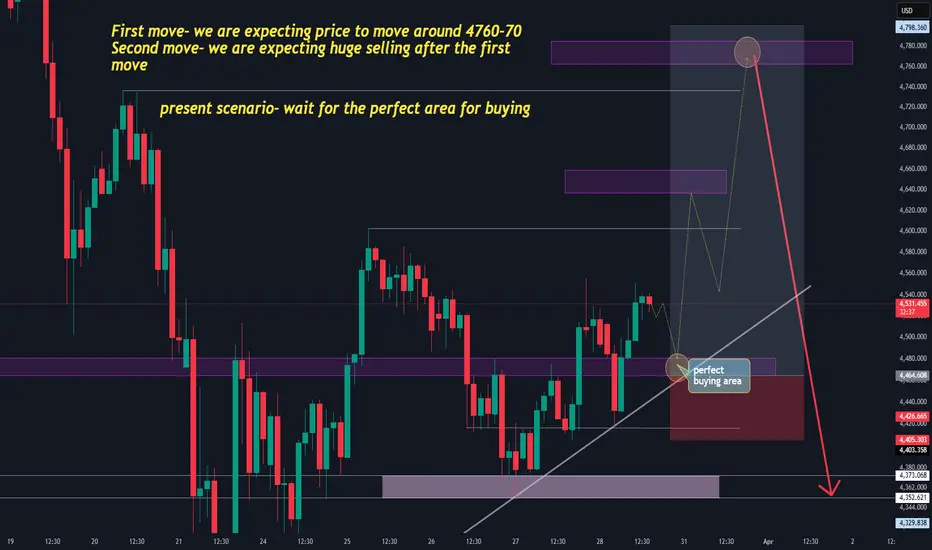
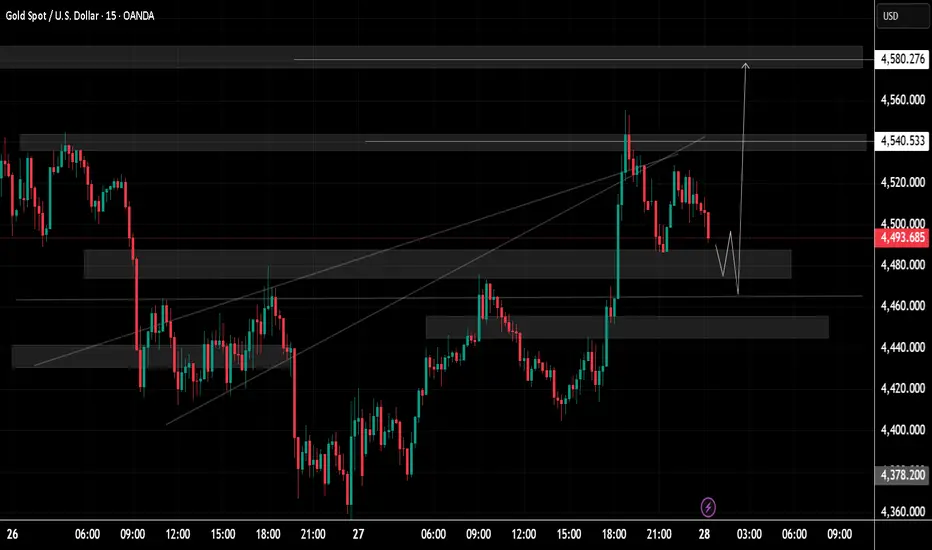
Gold next move (weekly analysis)(30th Mar-3rd April-2026)Go through the analysis carefully, and do trade accordingly.
Anup 'BIAS for the week (30th Mar-3rd April-2026)
Current price- 4525
"if Price stays above 4410-20, then the next target is 4580, 4660 and 4760 and below it 4350 and 4300"
Present scenario-
1. Wait for the perfect area for buying
2.
XAUUSDHello Traders! 👋
What are your thoughts on Gold?
Following a strong bullish rally, Gold has entered a corrective phase. The breach of the ascending trendline provides a clear signal that the previous bullish structure is weakening. Currently, the price is performing a pullback toward a key conflue
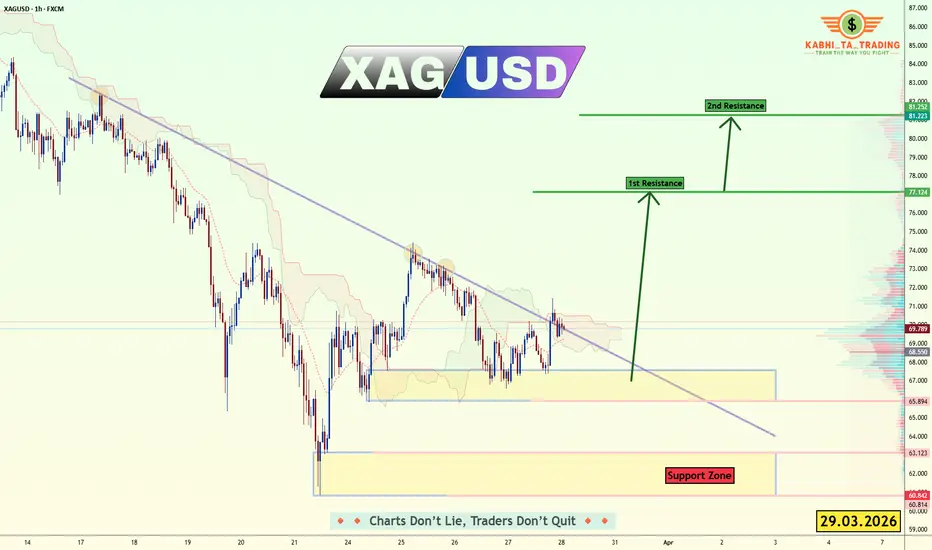
XAG/USD - Breakout Watch – Silver Ready for a Bullish Expansion?📊 Description & Setu p FX:XAGUSD
XAGUSD is currently consolidating within a strong support zone after breaking out of a major descending trendline on the 1h chart. If we see a decisive bounce and sustained momentum from this base, it opens the door for a high-probability play toward our upper res
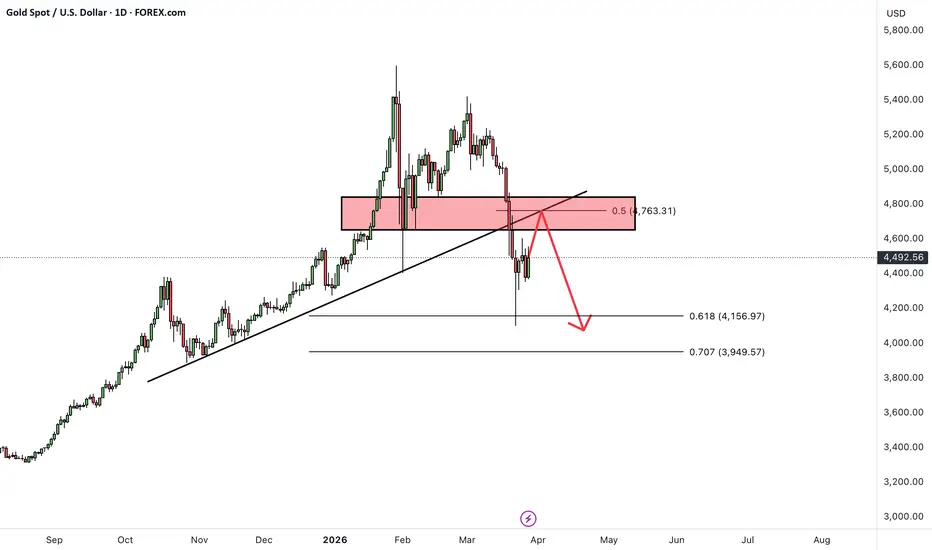
GOLD Price Update – Clean & Clear ExplanationGold is currently trading around 4,493, showing signs of short-term weakness after a strong bullish impulse. The market recently experienced a sharp upward move, pushing price into a key resistance zone near 4,540 – 4,580, where selling pressure has emerged.
now price in a downward phase, with sell
THIS IS NOT A REVERSAL, THIS IS HOW LIQUIDITY GETS TRAPPEDThe gold market enters the new week in a characteristic state of repricing after strong fluctuations, as the entire previous structure has been broken and capital is seeking a balance point. The macro context remains tug-of-war: growth shows signs of slowing but inflation has not truly cooled, makin

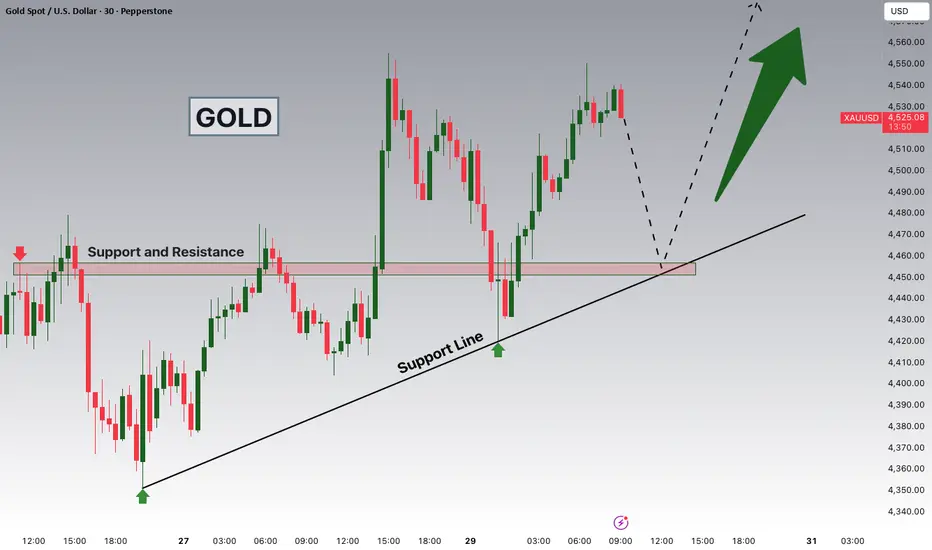
Gold 30M Bullish Structure Holding Above SupportGold has shifted into a short-term bullish structure after a CHoCH, with price holding above the rising trendline support. The market is consolidating near support while maintaining higher lows, suggesting potential continuation to the upside.
Bullish continuation: if price holds the 4,485–4,465 s

XAUUSD Rejection at 4,550 Signals Downside Risk To 4,390Hello traders! Here’s my technical outlook based on the current XAUUSD (4H) chart structure. Price moved inside an ascending channel before a rejection at the top signaled a shift. A break below channel support confirmed bearish structure. Currently, gold is trading below the 4,550 resistance (selle

XAUUSD Bullish at 4460 Ahead of NFP and Geopolitical Risks!Hey Traders, in today's trading session we are monitoring XAUUSD for a buying opportunity around the 4,460 zone. Gold is trading in an overall uptrend and currently is in a correction phase in which price is approaching the trendline support around the 4,460 support and resistance area.
From the ma
XAU/USD Selling Pressure Big Move IncomingGold is trading inside a descending channel, showing strong bearish 📉 pressure after multiple rejections at resistance. A clear head and shoulders pattern has already played out, followed by confirmed bearish 🔥 breakouts, strengthening downside momentum. Price continues forming lower highs and lower

See all futures ideas
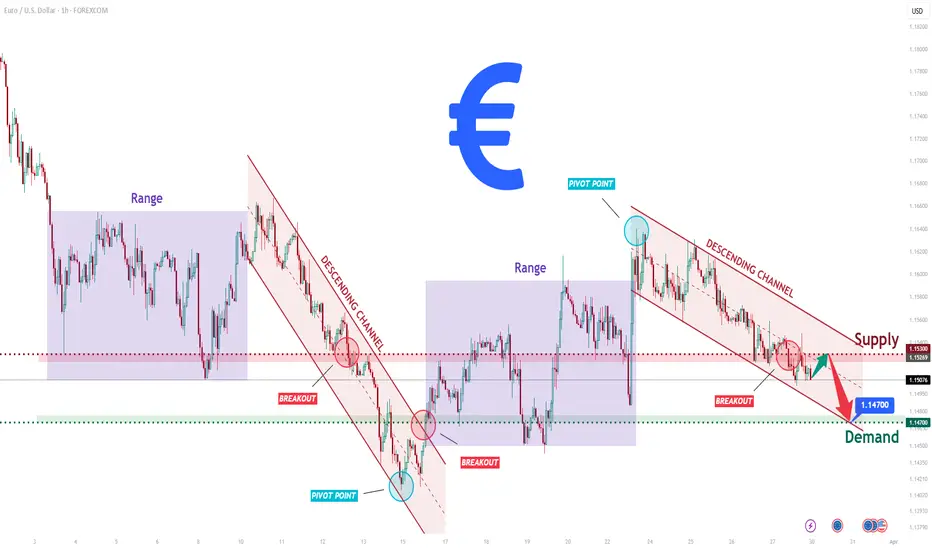
EURUSD Short: Bearish Channel Holds - Price Target 1.1470 DemandHello traders! Here’s my technical outlook based on the current EURUSD (1H) chart structure. EURUSD moved from a consolidation range into a descending channel, forming lower highs and confirming bearish pressure. After a brief range, price was rejected from a pivot high and continued lower.
Current
#AUDUSD: One Entry Zone, Two Targets, Bulls Comeback Soon✴️ The AUDUSD currency pair has recently shifted from a bullish to a bearish trend, evidenced by a significant change in character and a series of structural breaks. This decline commenced after the price reached the 0.7200 level. Since then, the price has consistently failed to find support, contin

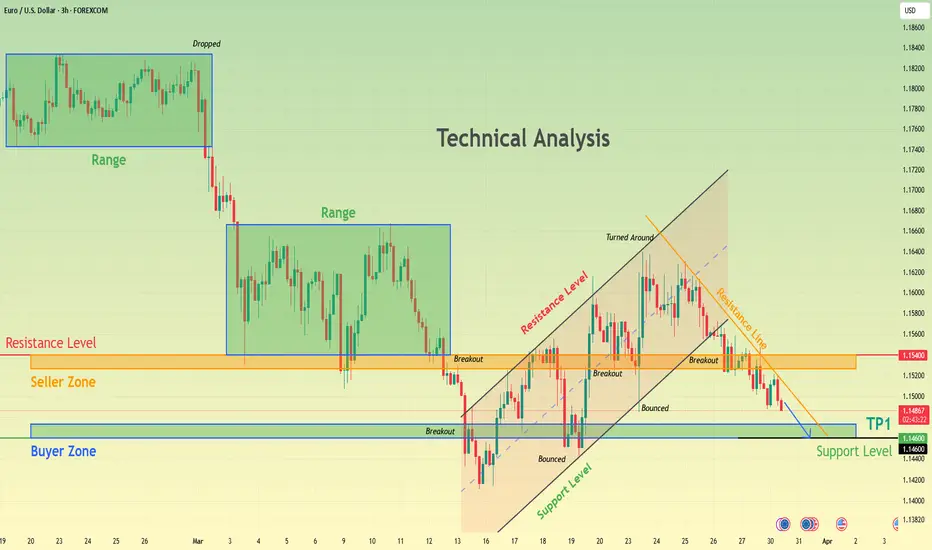
EURUSD Selling Pressure Builds - Support at 1.1460 AheadHello traders! Here’s my technical outlook based on the current EURUSD (3H) chart structure. Price initially moved inside a range before breaking down sharply, confirming strong bearish momentum. After the drop, EURUSD formed another consolidation range, which later broke to the downside, reinforcin
EURNZD: The Bullish Trend ContinuesEURNZD: The Bullish Trend Continues
From our previous analysis on Friday EURNZD reached the first target and is going up in clear way.
The broken resistance is not turned into support by rising the chances to push the price up even more during the coming days.
The Economic calendar is almost em

Market Overview (EURUSD – 1H)Price is currently in a short-term bearish structure after sweeping liquidity from the previous highs (BSL). The market has shown clear displacement to the downside, followed by a controlled pullback.
Structure shifted bearish after strong impulse
Lower highs + weak retracements forming
Price react

30.03.26 Daily ForecastPairs on Watch -
FX:EURUSD : Currently short on this pair after the multiple 1H rejections at the V shape. I am aiming for the lows as my main target and will be keeping a close eye on the DXY movements. I may have to manage aggressively if need be which is fine, as the positioning is good but t

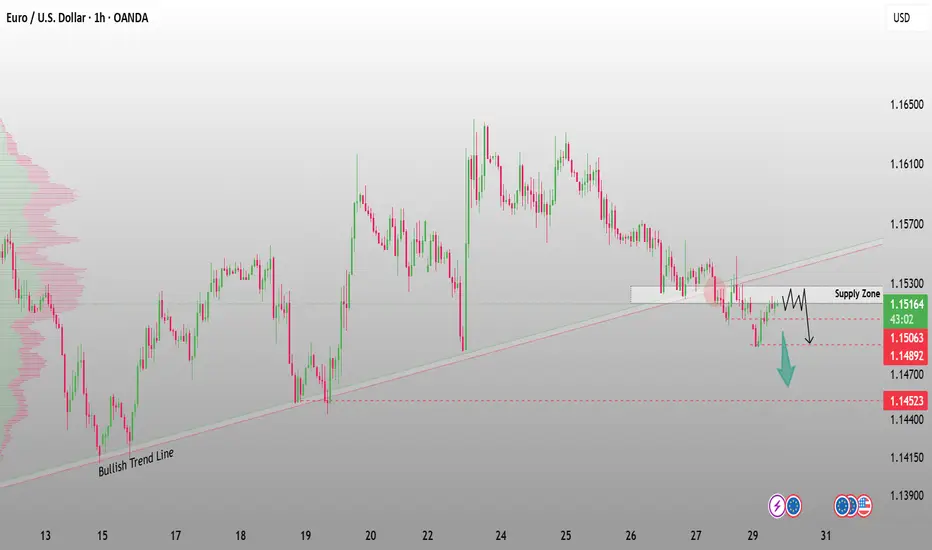
EURUSD is showing signs of a bullish trend breakdown💱 EURUSD – Bearish Breakdown Opportunity 🔻📉
EURUSD is showing signs of a bullish trend breakdown on the 1-hour timeframe ⏱️ and is now reacting from a key supply zone around 1.15200 — potential short setup in play.
💡 Trade Setup:
🔹 Entry Zone: 1.15200 (Supply Area)
🎯 Target 1: 1.15000
🎯 Target 2:
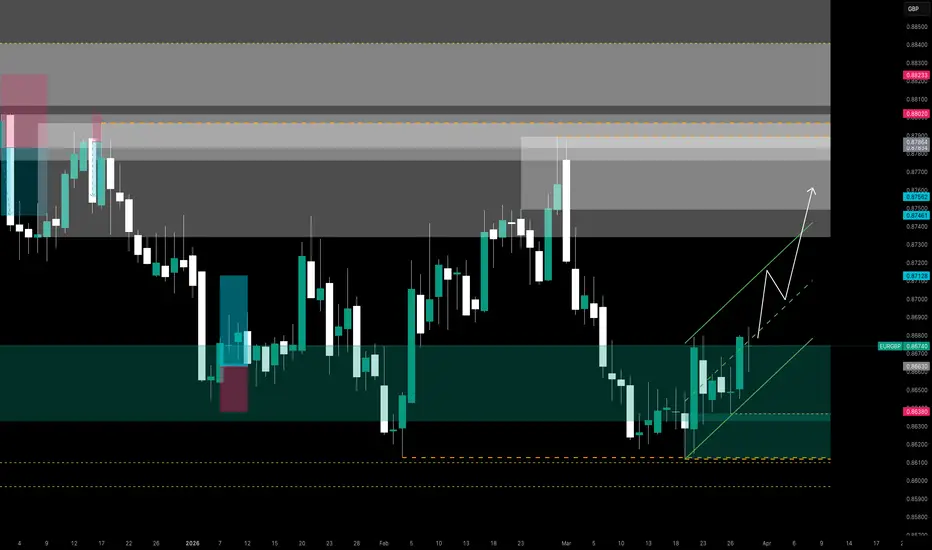
EUR/GBP Daily Outlook: Rebound Building from DemandOn EUR/GBP, my short-term view is constructive, but still balanced on the broader daily structure. Price has reacted cleanly from the 0.8610–0.8640 demand and is now pushing higher, forming higher lows. As long as this area holds, I see room toward 0.8745/0.8760. However, I do not consider this a fu
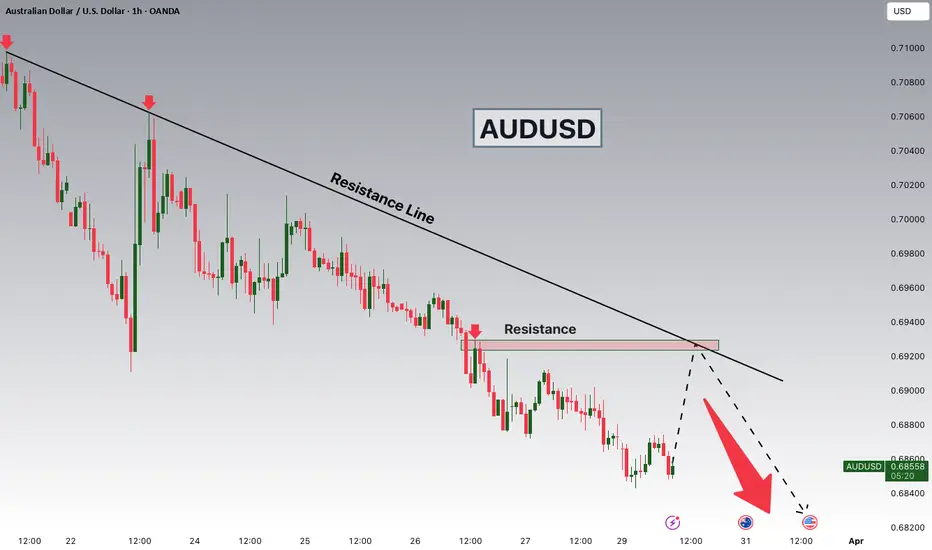
AUDUSD:Strong USD & Risk-Off Sentiment Pressure Aussie Lower!Hey Traders, in today's trading session we are monitoring AUDUSD for a selling opportunity around the 0.69000 zone. AUDUSD is trading in a downtrend and currently is in a correction phase in which price is approaching the trendline resistance around the 0.69000 support and resistance area.
From the
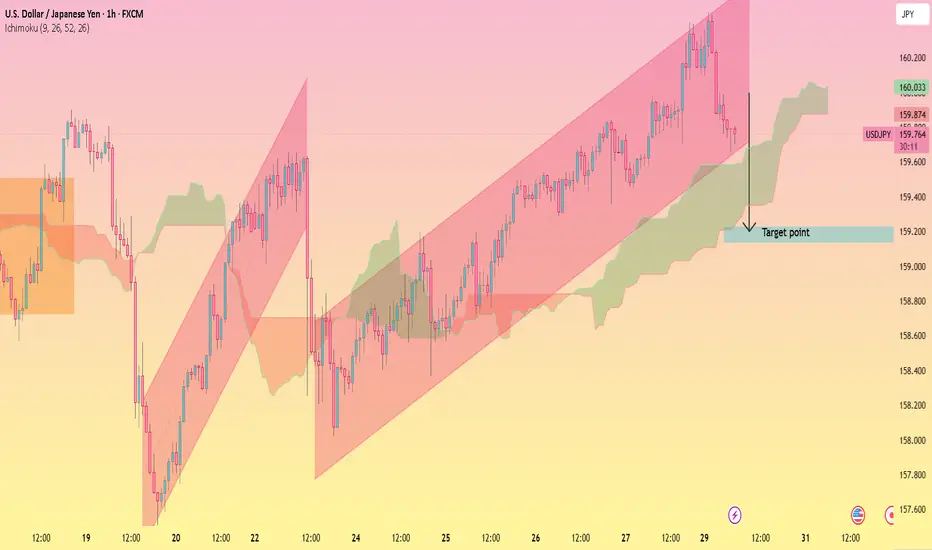
USDJPY Bullish Channel Setup
The chart shows a clear bullish trend on USDJPY moving inside an ascending channel. Price has been respecting the channel boundaries with higher highs and higher lows, supported by the Ichimoku cloud acting as dynamic support. Recently, price reached the upper zone and is showing a potential pullba
See all forex ideas
Trade directly on Supercharts through our supported, fully-verified, and user-reviewed brokers.


