15

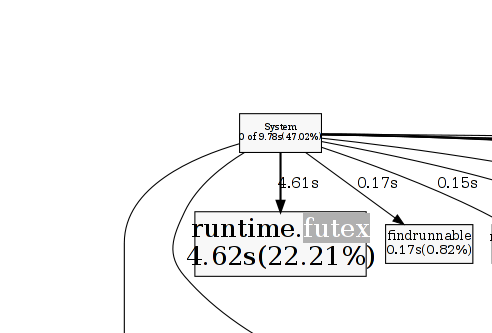
Running go tool pprof with a cpu profile for https://github.com/vimeo/statsdaemon and typing "web" I get an svg profile with extensive use of "runtime.futex". But I can't see where it's coming from, it just says "System".

I want to know which code my program invokes, that causes so much time spent in runtime.futex.

profile screenshot

To be sure I passed '-nodefraction=0' which makes it not drop nodes in the web svg view, though it says "showing top 80 nodes out of 246 (cum >= 0.11s)", maybe this is related.

I tried https://code.google.com/p/gperftools/ and it shows the same. The viz drops no nodes or edges, but still "runtime.futex" just shows up under "System" and that's the root node?

2
  • are you using osx? godoc.org/rsc.io/pprof_mac_fix Commented Apr 27, 2015 at 0:24
  • No, Arch Linux 3.18 64bit Commented Apr 27, 2015 at 0:58

2 Answers 2

8

A futex or "Fast user space mutex" is a linux system call that is used for basic locking. I imagine the go runtime uses it quite a bit under the hood.

Without seeing some of the code it's hard to say for sure but for highly concurrent code with a lot of coordination using channels it's possible that the futex calls really are coming from System and no particular function.

Sign up to request clarification or add additional context in comments.

Comments

5

When I've faced with such issue I've used runtime/trace where I've see that some function was called very often and this function creates new ticker by

ticker := time.NewTicker()

but does not stop it by

defer ticker.Stop()

Also, don't forget to stop timers as well:

timer := time.NewTimer(duration)
defer timer.Stop()

Comments

Your Answer

By clicking “Post Your Answer”, you agree to our terms of service and acknowledge you have read our privacy policy.

Start asking to get answers

Find the answer to your question by asking.

Ask question

Explore related questions

See similar questions with these tags.