Real-time observability dashboard for Claude Code and Codex agents.
Includes powerful filtering, searching, and visualization of multi-agent sessions with full replay and token usage stats.

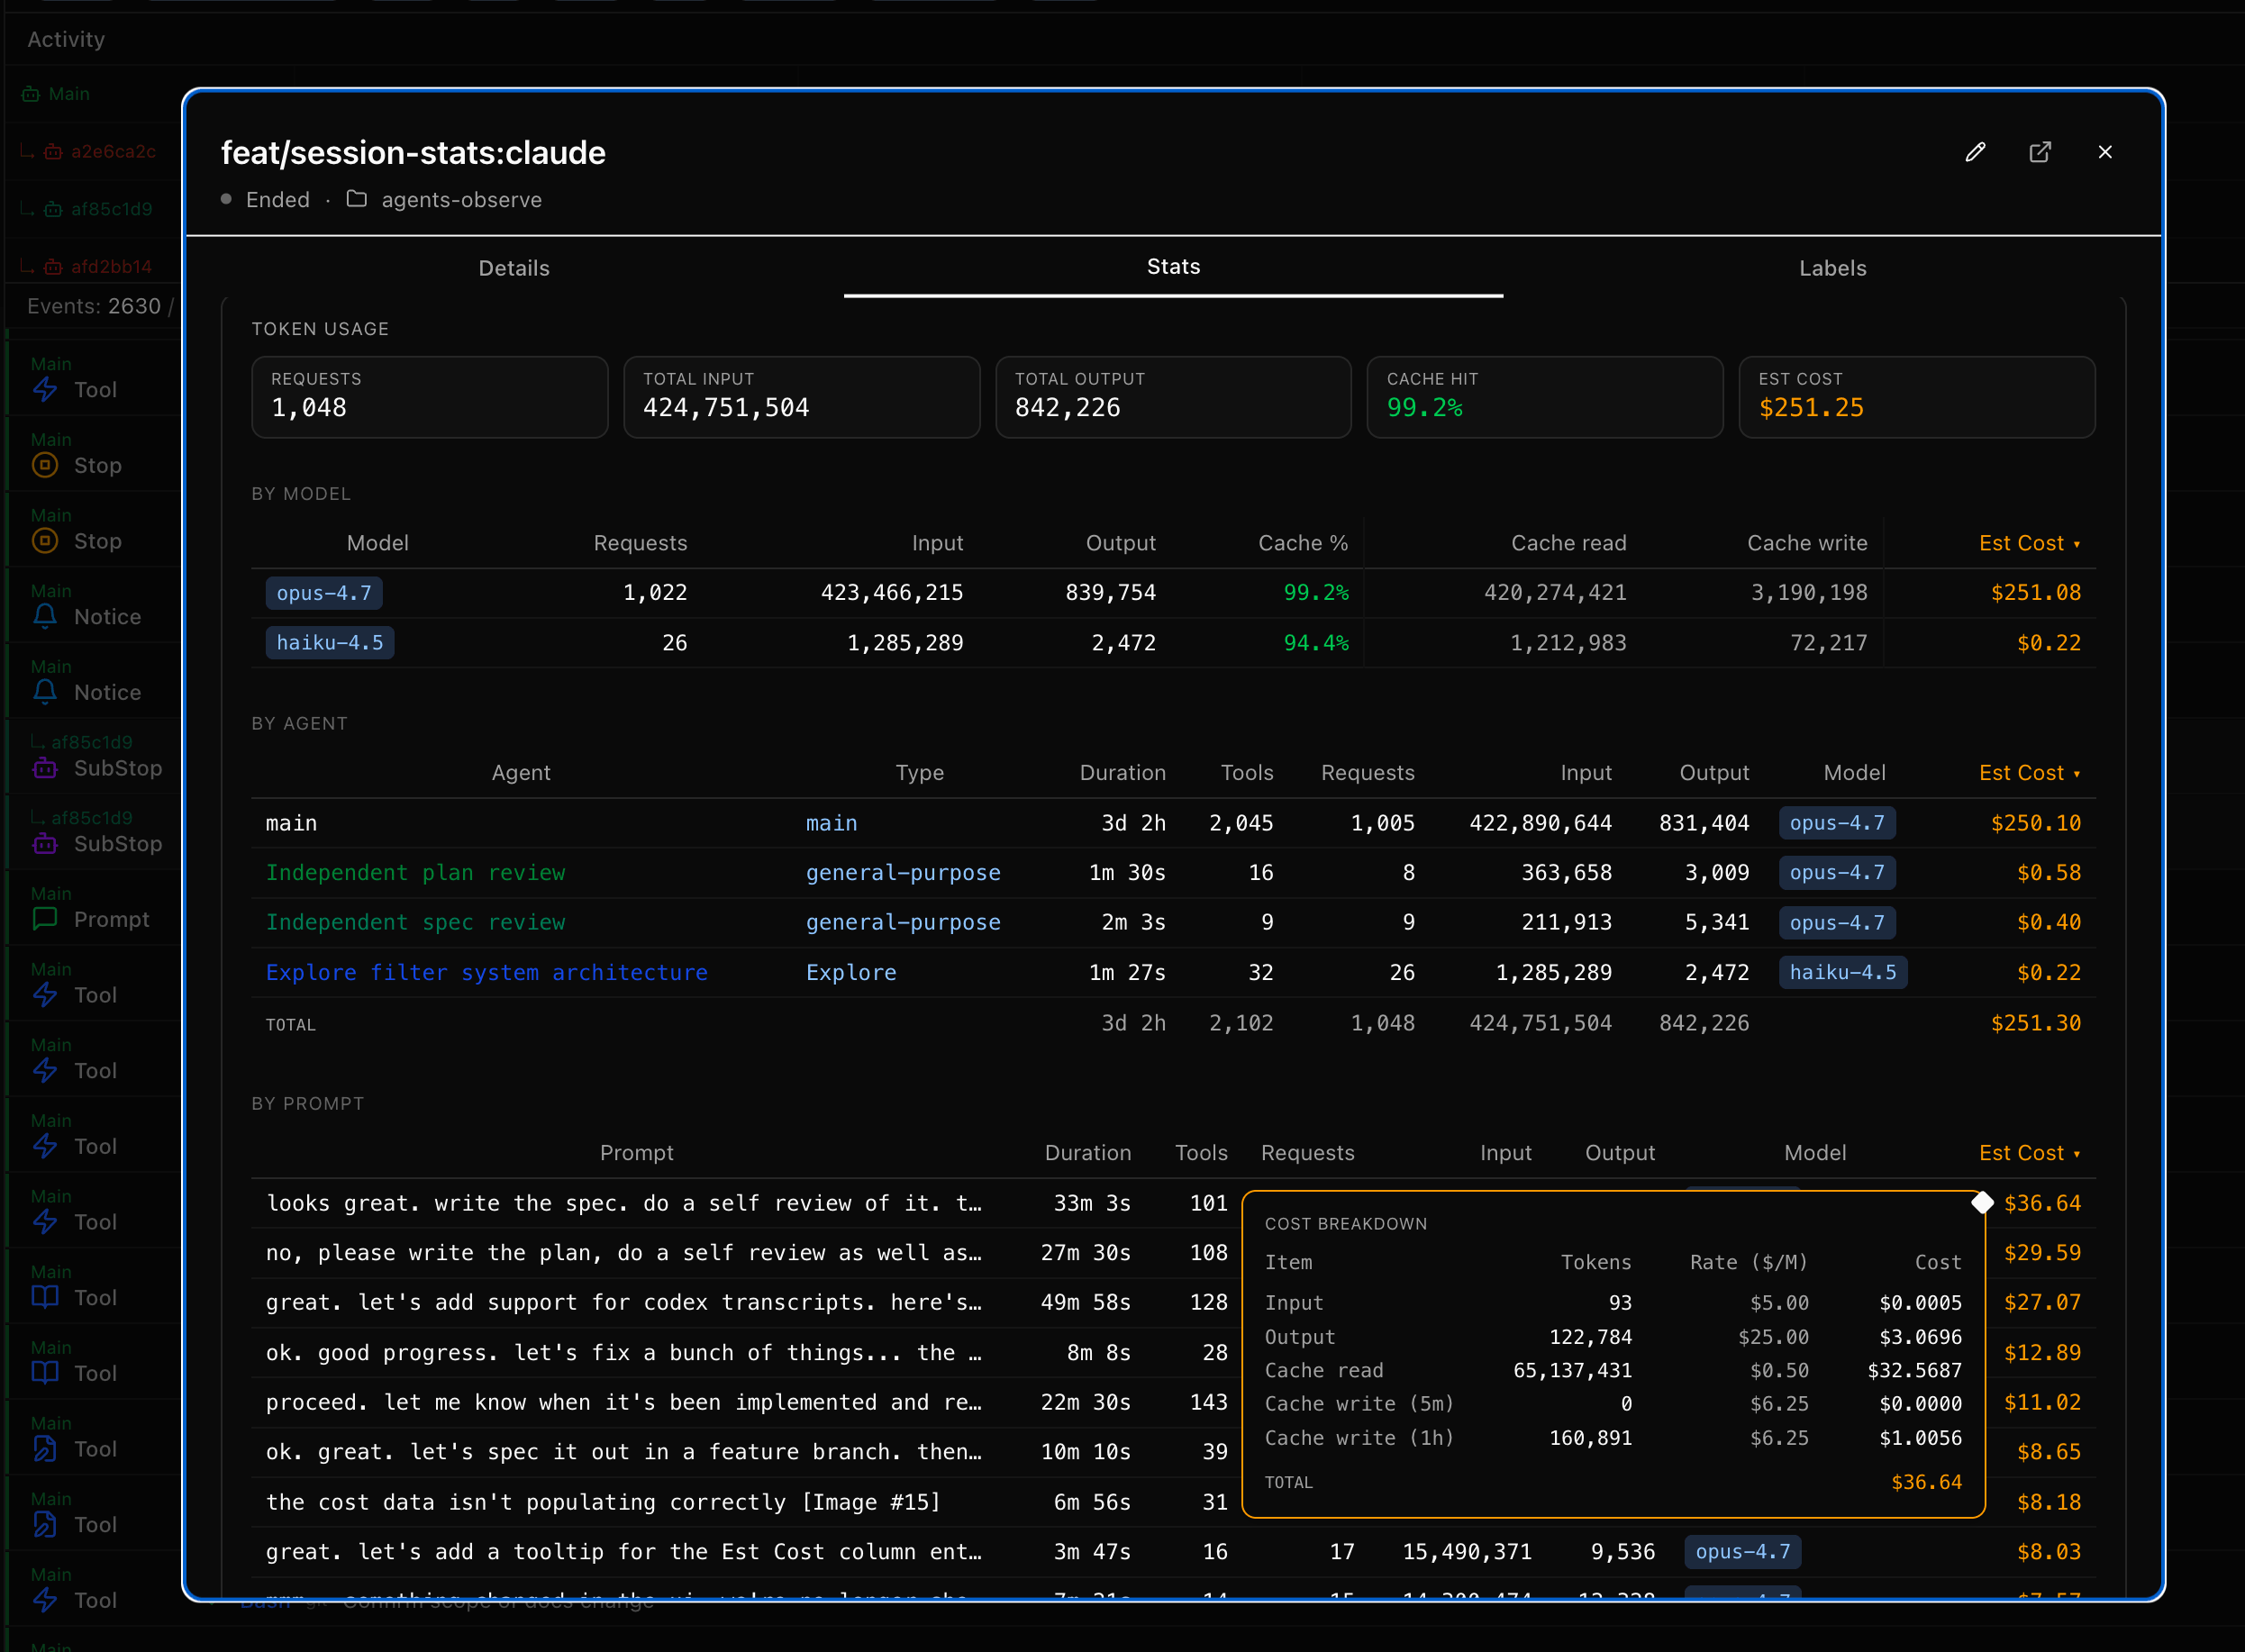
Version 0.9.7 adds token usage and cost breakdowns in session stats.
Install as a claude code plugin:
# Add this repo as a marketplace
claude plugin marketplace add simple10/agents-observe

# Install the plugin
claude plugin install agents-observe

# Then just run claude
# The plugin will auto start the MCP server and capture events
claude

# Use the /observe skill in claude to check status, restart the server, etc.
> /observe status
> /observe debug
> /observe logs
> /observe restart

# Open the dashboard UI in a browser
open http://localhost:4981
Default dashboard URL: http://localhost:4981
By default, the SQLite DB and logs live under:
$CLAUDE_PLUGIN_DATAwhen running as a Claude plugin. Claude Code names this dir<plugin>-<marketplace>— so a marketplace install lands at~/.claude/plugins/data/agents-observe-agents-observe/, and a--plugin-dirinstall lands at~/.claude/plugins/data/agents-observe-inline/.~/.agents-observe/when running outside Claude (Codex, manual CLI, dev).
The DB sits at <root>/data/observe.db, logs at <root>/logs/.
To pin the location somewhere else — e.g. an external volume — set
AGENTS_OBSERVE_LOCAL_DATA_ROOT in your ~/.claude/settings.json:
Upgrading the plugin preserves your DB automatically. If you're upgrading
from a pre-fix version (≤ 0.9.8) the server scans for a DB under the old
version-scoped install dir on first start and copies it into the stable
location. See <root>/data/.migrated-from.json for the record.
- Docker — the server runs as a container
- Node.js — hook scripts run via
node - Bash - hooks are configured to use
hooks.shfor fast fire and forget event logging
If docker, node, or bash are not installed on your host, the plugin will fail to properly load.
Use the /observe debug claude command to help troubleshoot and fix installation issues.
| Skill | Description |
|---|---|
/observe view |
Open the current session in the dashboard |
/observe stats |
Open the current session's stats modal in the dashboard |
/observe |
Open the dashboard URL and check if the server is running |
/observe status |
Show server health, version, runtime, and config details |
/observe start |
Start the server |
/observe stop |
Stop the server |
/observe restart |
Restart the MCP server |
/observe logs |
Show recent Docker container logs |
/observe debug |
Diagnose server issues (health, docker logs, mcp.log, cli.log) |
When Claude Code runs autonomously — spawning subagents, calling tools, reading files, executing commands — you have no visibility into what's actually happening. The terminal shows a fraction of the activity. Subagents are invisible. Tool calls blur together. And when something goes wrong three agents deep in a parallel execution, you're left reading through logs after the fact.
Agents Observe captures every hook event as it happens and streams it to a live dashboard. You see exactly what each agent is doing, which tools it's calling, what files it's touching, and how subagents relate to their parents. In real time.
This matters because:
- Multi-agent work is opaque. A coordinator spawns a code reviewer, a test runner, and a documentation agent in parallel. Without observability, you only see the final result. With it, you watch each agent work and catch problems as they happen.
- Tool calls are the ground truth. The assistant's text output is a summary. The actual tool calls — the Bash commands, file reads, edits, grep patterns — tell you what Claude is really doing. Agents Observe shows you both.
- Debugging is time travel. When a subagent makes a bad edit or runs a destructive command, you need to trace back through the exact sequence of events. The event stream gives you that timeline with full payloads.
- Sessions are ephemeral, but patterns aren't. By capturing events across sessions, you can see how agents behave over time, which tools they favor, and where they get stuck.
- Watch tool calls stream in as they happen (PreToolUse → PostToolUse with results)
- See the full agent hierarchy — which subagent was spawned by which parent
- Filter by agent, tool type, or search across all events
- Expand any event to see the full payload, command, and result
- Click timeline icons to jump to specific events in the stream
- Browse historical sessions with human-readable names (e.g., "twinkly-hugging-dragon")
Claude Code Hooks  →  observe_cli.mjs  →  API Server (SQLite)  →  React Dashboard
  (agent-lib build)     (HTTP POST)        (parse + store)        (WebSocket live)
observe_cli.mjs reads the raw event from stdin and dispatches to an agent-class-specific lib (hooks/scripts/lib/agents/<class>.mjs) whose buildHookEvent() constructs the envelope — including agent-class-aware flags like meta.isNotification / meta.clearsNotification — then POSTs it to the server. The server applies those flags mechanically to its stored state (e.g. pending_notification_ts) and forwards events to subscribed WebSocket clients; it stays agent-class-neutral. The React dashboard derives all agent state (status, event counts, timing) from the event stream.
For development or running without the plugin. If you installed via the plugin above, skip this section.
git clone https://github.com/simple10/agents-observe.git agents-observe
cd agents-observe

# Install just if needed
brew install just

# Start the docker container
just start

# Or start local dev servers
just install
just dev
See justfile for additional commands.
Copy the hooks from .claude/settings.json into your project's settings.in this repo into your target project's Claude Code settings:
- Project-level (recommended):
.claude/settings.jsonin your project root - User-level (all projects):
~/.claude/settings.json
Update the $CLAUDE_PROJECT_DIR paths to point to your agents-observe install location.
Environment variables set in the config:
A few commonly used ones:
| Variable | Default | Description |
|---|---|---|
AGENTS_OBSERVE_SERVER_PORT |
4981 |
Server port. |
AGENTS_OBSERVE_NOTIFICATION_ON_EVENTS |
Notification |
Comma-separated hook events that trigger the bell. Empty string disables bells. |
AGENTS_OBSERVE_PROJECT_SLUG |
(auto-detected) | Project slug shown in the dashboard URL. If not set, derived from the session transcript path. |
AGENTS_OBSERVE_API_BASE_URL |
http://127.0.0.1:4981/api |
Full URL for the events endpoint. |
See docs/ENVIRONMENT.md for the full list.
# Check the server is running
just health

# Send a test event
just test-event
Navigate to http://localhost:5174 (dev) or http://localhost:4981 (Docker). You should see the test event appear. Start a Claude Code session in your configured project and events will stream in automatically.
If you have just installed:
# Development:
just install      # Install all dependencies
just dev          # Start server + client in dev mode (hot reload)
just test         # Run all tests (server + client)
just test-event   # Send a test event to the server
just fmt          # Format all source files

# Server (Docker):
just build        # Build the Docker image locally
just start        # Start the server (same path as plugin MCP)
just stop         # Stop the server
just restart      # Restart the server
just logs         # Follow Docker container logs
just start-local  # Start server locally without Docker

# Utilities:
just health              # Check server health
just health              # Check server health
just db-reset            # Delete the events database
just cli <command>       # Run CLI directly (hook, health, start, stop, restart, logs)
just open # Open the dashboard in browserapp/
server/ # Node server — Hono routes, SQLite, WebSocket
client/ # React 19 + shadcn dashboard
hooks/
hooks.json # Plugin hook definitions
scripts/ # CLI, MCP server, and shared libs
skills/ # /observe skills
scripts/ # Release tooling
test/ # Integration tests
docs/ # Plans and demo assets
.claude-plugin/ # Plugin + marketplace manifests
.env # Env config options used by cli & local server
.mcp.json # MCP server configuration
Dockerfile # Production container image
docker-compose.yml # Container orchestration - not used by the plugin
justfile # Task runner commands
start.mjs # Local server entrypoint (non-Docker)
vitest.config.ts # Test configuration
package.json # Version metadata and workspace scripts
Hooks fire on every Claude Code event (tool calls, prompts, stops, subagent lifecycle). observe_cli.mjs reads the raw event from stdin and dispatches through hooks/scripts/lib/agents/<class>.mjs — each agent class's buildHookEvent() builds the envelope (project metadata plus agent-class-aware flags like meta.isNotification / meta.clearsNotification) and the CLI POSTs it to the server. If the server needs additional data (like the session's human-readable slug), it responds with a request — the hook reads it from the local transcript file and sends it back.
Server receives raw events, extracts structural fields (type, tool name, agent ID), stores agent metadata (name, description, type, parentage), and saves everything in SQLite. Events are forwarded to WebSocket clients subscribed to the relevant session — each browser tab only receives events for the session it's viewing. The server tracks session status (active/stopped) but does not track agent status.
Client fetches events via REST API on initial load, then receives real-time updates via WebSocket (events are appended to the local cache — no refetching). All agent state (status, event counts, timing) is derived from the event stream. Tool events are deduped client-side (PreToolUse + PostToolUse merged into a single row). The emoji icon mapping and summary generation are editable config files.
In dev mode, the client and server run as separate processes with separate ports.
In production or docker mode, the client is bundled and served by the server. Both the API and dashboard are served from the same process and port.
Both local dev and Docker flows default to using the same sqlite database in ./data. The database is auto created as needed.
Docker not running?
The plugin requires Docker to run the server. Make sure Docker Desktop (or the Docker daemon) is running, then restart Claude Code.
Port 4981 in use?
The server auto-assigns a free port if 4981 is taken. To explicitly set a port, add AGENTS_OBSERVE_SERVER_PORT=<port> to your environment or .env file.
Plugin not capturing events?
Run /observe debug to diagnose. It checks server health, Docker container logs, MCP logs, and CLI logs. You can also run /observe status for a quick health check.
Events not appearing in the dashboard?
- Is the server running? Run
just healthto check. - Is the hook script configured? Copy the hooks from
.claude/settings.jsoninto your project's settings. - Is
AGENTS_OBSERVE_PROJECT_SLUGset? IfAGENTS_OBSERVE_PROJECT_SLUGis not set, the project is auto-detected from the session transcript path. - Can the hook reach the server? Run
just test-event— if the event appears in the dashboard, the server is reachable.
WebSocket disconnected?
The client reconnects automatically every 3 seconds if the WebSocket connection drops. You'll see "Disconnected" in the sidebar footer. Events received during reconnection will appear once the connection is restored and the events are refetched.
Database issues?
Run just db-reset to delete the SQLite database and start fresh (stops the server, deletes the db, restarts). The database is auto-created on the next server start.
- Add support for Codex
- Add support for OpenClaw
- Add support for pi-code agents
--
- Claude Hooks - official list of currently supported hooks
- Agent Super Spy - full observability stack for agents, can be run locally or remotely
- Multi-Agent Observability System - inspired this project
- Claude DevTools - visualization for claude session files, requires running on local machine
MIT