This is an ad-hoc project developed as a tool for Clément Larue of UMR Biogeco, to compute canopied areas surrounding a central tree.
Three methods were developed, a heuristic, an approximation, and an exact algorithm, the latter being the best of the three methods. For experience showcasing purposes, the other methods were kept. (Also, visualisations through JBotSim were created for the heuristic and approximation algorithms, but not for the exact algorithm.)
The heuristic is based on the Monte Carlo method, and can be viewed below. The green circles represent trees as seen from above. Inside the red buffer circle two types of areas are considered: the green canopied area, and the red uncanopied area. Small buffer circles may represent the reach of fallen fruit from the central tree, while larger buffer circles may represent the reach of its pollen carried by wind or insects, or the territory of a beehive placed in the central tree.
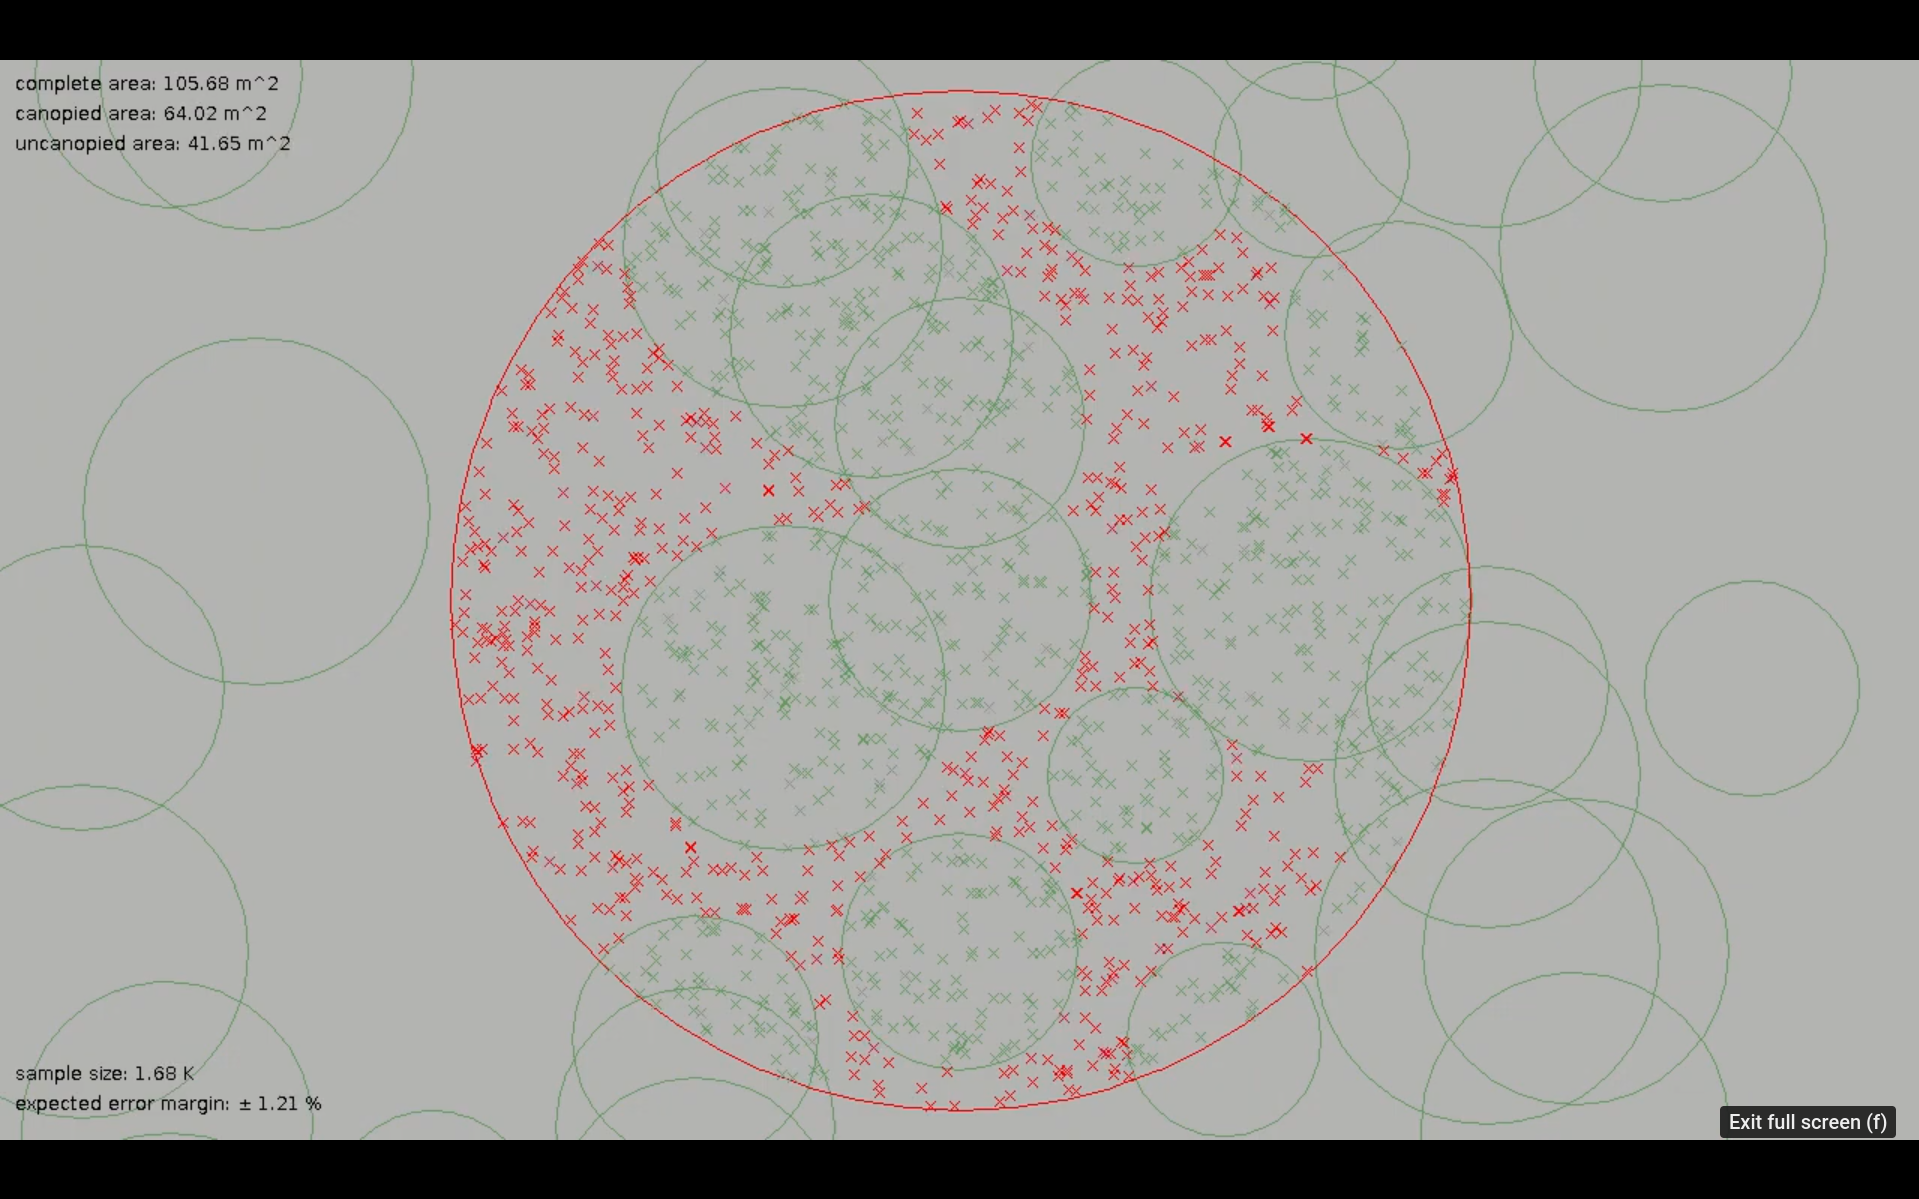
The Monte Carlo method is a stochastic method using random data points in the buffer circle, to estimate the ratio between canopy and non-canopy areas in the shape. It comes with some expected garantee of quality of solution, which can be viewed in the video as well. The more random data points, the higher the expected quality. Nevertheless, it can still be arbitrarily wrong, which is what the next method solves.

The Quad Tree algorithm partitions the space into squares, of which the area is easily computed. Squares are inserted only in completely canopy area, or completely non-canopy area. On the boundary between canopy and non-canopy, smaller and smaller squares cover the remaining space, and the boundary area grows smaller and smaller. This is what gives the garanteed approximation result, shown in the video.
Finally, we showed that a collection of overlapping circles can be partitioned in to a collection of polygons (where circles overlap) and "pizza slices" (the remaining parts), such as shown below. Both such shapes have easily computed areas.

