Generic Datasets
The codebook for generic datasets (a.k.a., codebook-generic) is slightly different than other codebooks you might have encountered. The two main differences are:
- A graphic is produced for each variable.
- Horizontal bar charts (or dot plots) for categorical variables.
- Hybrid histogram/boxplots for continuous variables.
- Each variable summary is confined to a 1" tall strip.
Example categorical summary
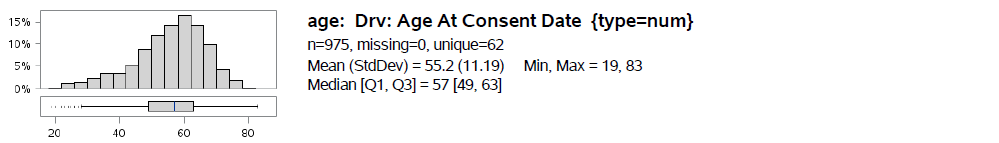
 Example continuous summary
There are several files contained in the download, but the one that you will use to produce the codebook-generic is codebook_generic.sas. The parameters are as follows.
EITHER
-
data=A space-separated list of two-level dataset names.
E.g.,data=work.fred sdtm.george adam.charlie
OR
-
library=A library of datasets.
If specified, thedata=parameter will be ignored.
BUT NOT BOTH
-
pdfpath=The folder in which to save the PDF report.
Default: the folder in which the dataset lives. -
pdfprefix=A prefix to add to the PDF file name.
Default: no prefix. -
dotlength=Length after which long text is replaced with 3 dots (...).
Default: 20. -
maxfreqs=Maximum number of categories to show.
Default: 5. -
minfreqs=Minimum number of categories needed to avoid frequencies for numeric variables.
Default: 2. -
plotheight=Height of plots in inches.
Default: 1.0. -
uniquepct=Highest allowed percent of unique values for showing frequencies.
Default: 90. -
lowestpct=Lowest allowed percent for showing frequencies.
Default: 0.5. -
catplot=Type of categorical plot: dot | hbar.
Default: dot. -
appendix=Include appendix of all categorical values: yes | no.
Default: no -
maxappx=Maximum number of unique values a variable can have and still be allowed to show up in the appendix.
Default: 20 -
debug=Set to 1 if you wish to retain work datasets: 0 | 1.
Default: 0.
*--- one codebook --;
*--- saved in the adam library ---;
*--- with file name adam.adsl.pdf ---;

%codebook_generic(data=adam.adsl)
*--- one codebook per dataset in the sdtm library ---;
*--- saved in a subfolder ---;
*--- with (...) added after 15 characters ---;

%codebook_generic
   (library=sdtm
   ,pdfpath=H:\mystudy\sdtm\codebooks
   ,dotlength=15
   )
An example use of the generic codebook.
- You can specify the
data=parameter or thelibrary=parameter, but not both. - Formats must be loaded prior to calling the macro.
- Both the unformatted and formatted values will be presented in categorical summaries. E.g.,
1 = MALE (22, 44%), 2 = FEMALE (28, 56%). - If you increase
maxfreqs=, you are likely to experience tick mark thinning on the y-axis. You can compensate by increasingplotheight=. - Both the
uniquepct=andlowestpct=parameters are an attempt to prevent meaningless categorical summaries for variables which contain mostly unique values (e.g., subject number).
There are admittedly certain limitations to this style of codebook, primarily dealing with the categorical variables. Some limitations include the following:
-
The first limitation has to do with long text strings. There is simply not enough horizontal space in the graphic to display more than about 20 characters. Even at 20 characters, the y-axis tick values in the horizontal bar charts take up about half of the graphic space. The codebook-generic deals with long text strings by truncating them at 20 characters and placing three dots (...) at the end of the string.
Note: the value 20 is configurable. -
The second limitation has to do with categorical variables that have a large number of categories. Given the self-imposed restriction to summarize each variable in a 1" tall strip, there is simply not enough vertical space in the graphic to display more than 5 categories. The codebook-generic deals with the problem by displaying only the 5 most frequently occurring categories.
Note: the value 5 is configurable.
Given these limitations, you might want to think of the codebook-generic as a "getting to know you" sort of program. This is in contrast to more traditional codebooks which you might think of as "everything you ever wanted to know" sorts of programs.
Which style of codebook is better? Well, that depends on what you're trying to use it for. If you've just had a pile of new data dumped in your lap and you just want to gain surface-level familiarity, then maybe the codebook-generic is for you. On the other hand, if you already have a surface-level familiarity and you need to know the answers to questions like "what are all of the possible values of COUNTRY in this dataset", then a more traditional codebook might be more appropriate.