Data visualization WordPress plugin - AI tools
-
 Vizblock Powerful Gutenberg Block plugin to design beautiful, interactive charts directly in WordPress
Vizblock is a WordPress Gutenberg block plugin that enables users to create stunning, interactive charts with an intuitive drag-and-drop interface, no coding required.
- Pay Once
-
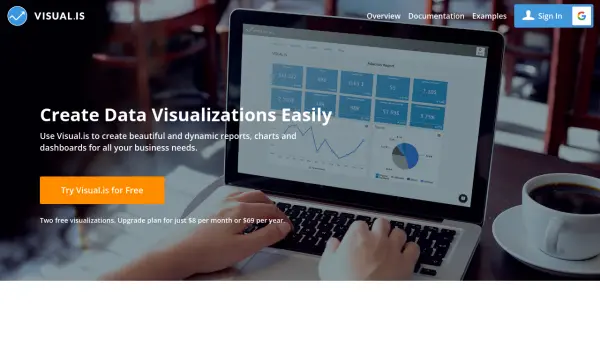 Visual.is Create beautiful and dynamic data visualizations easily
Visual.is is an AI-powered platform that enables users to create professional reports, charts, and dashboards without technical expertise, offering user-friendly tools with beautiful design templates.
- Freemium
- From 8$
-
 Exploring Data Interactive Data Visualizations with Open Data and Open Source Tools
Exploring Data is a platform showcasing interactive data visualizations created using open data and open source tools, featuring various network graphs, 3D globes, and geographic maps.
- Free
-
 Datawrapper Create better charts, maps, and tables with ease
Datawrapper is a powerful web application that enables users to design and publish high-quality data visualizations, including charts, maps, and tables, with professional and accessible results.
- Freemium
- From 599$
-
 Datacopia Effortless Data Visualization for Everyone
Datacopia enables users to effortlessly generate a wide variety of charts and graphs from their data, streamlining data analysis and visualization tasks.
- Other
-
 InstaCharts Instant Data Visualization and Smart Chart Creation
InstaCharts is an intuitive data visualization tool that uses smart technology to automatically generate interactive charts and tables from your spreadsheet data. Easily create, customize, share, and embed compelling visualizations for reports, websites, and data exploration.
- Freemium
- From 10$
-
 VisioChart Transforming complex data into interactive visual formats.
VisioChart offers a diverse range of Power BI visualizations to transform complex data into interactive visual formats, enabling users to create engaging charts without coding or design skills.
- Contact for Pricing
-
 wpDataTables The best WordPress table plugin for building responsive data tables
wpDataTables is a WordPress table plugin that enables users to create responsive, interactive data tables from various sources without coding, trusted by over 80,000 users worldwide.
- Paid
-
 Themeisle WordPress Themes & Plugins for Your Voyage
Themeisle provides long-lasting WordPress themes and plugins, including Neve, Hestia, Otter Blocks, and Feedzy RSS Feeds, designed for ease of use and optimal performance.
- Paid
- From 399$
-
 ChartPixel Automated charts and insights in 30 seconds
ChartPixel is an AI-powered data analysis platform that transforms complex data into clear visualizations and actionable insights without coding. It offers automated data cleaning, statistical analysis, and instant chart generation suitable for both beginners and professionals.
- Freemium
- From 15$
-
 Insiderviz AI-powered data visualization platform
Insiderviz is an AI tool for creating interactive data visualizations and insights from complex datasets.
- Other
-
 gistapp.com Create engaging, connective microsites from your structured data
Gist is an AI-powered data visualization platform that transforms structured data into interactive microsites, enabling businesses, museums, and researchers to share insights through intuitive visualizations and collaborative tools.
- Other
-
 welcome.calcgen.ai Build Beautiful, Interactive, Customizable Data Visuals in Seconds
CalcGen uses a swarm of AI agents to automatically research, analyze, and create interactive, customizable data visualizations from a single prompt.
- Paid
- From 10$
-
 Quadrigram Turn your data into knowledge with interactive visualizations
Quadrigram is a visual drag-and-drop data editor that transforms data into engaging stories through interactive visualizations, combining texts, images, and charts without coding skills.
- Freemium
- From 20$
-
 ApexCharts Modern & Interactive Open-source Charts for Developers
ApexCharts is an open-source charting library that enables developers to create beautiful, interactive data visualizations for web applications with extensive API documentation and multiple chart types.
- Freemium
- From 17$
-
 FusionCharts Build interactive, responsive, and beautiful JavaScript charts for any framework
FusionCharts provides high-performance JavaScript charting libraries for creating interactive, responsive charts and dashboards across frameworks like React, Vue, Angular, and pure JavaScript, trusted by over 800,000 developers.
- Free Trial
-
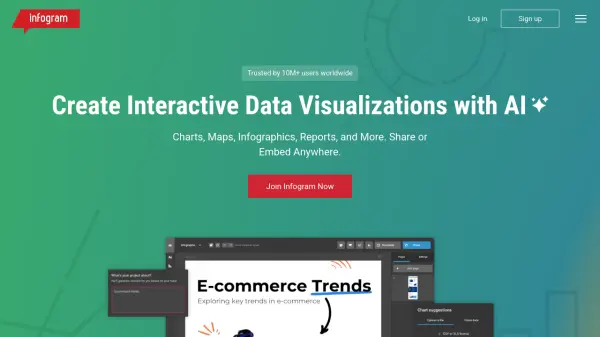 Infogram Create Interactive Data Visualizations with AI
Infogram is a data visualization platform that allows users to create interactive charts, maps, infographics, reports, and more. Leverage AI to enhance your workflow and share or embed your creations anywhere.
- Freemium
- From 19$
-
 Instadeq No-code Data Analysis & Interactive Visualizations
Instadeq is a no-code platform enabling users to transform various data sources like spreadsheets and APIs into interactive, always up-to-date dashboards.
- Contact for Pricing
Featured Tools
Join Our Newsletter
Stay updated with the latest AI tools, news, and offers by subscribing to our weekly newsletter.

Explore More
-
Personalized book suggestions 19 tools
-
Natural sounding AI voice for podcasts 50 tools
-
Collaborative presentation software 24 tools
-
automated tiktok video publishing 13 tools
-
affiliate network solution with support 22 tools
-
technical seo audit for business 46 tools
-
field sales automation platform 14 tools
-
AI in healthcare imaging 15 tools
-
voicebot platform 12 tools
Didn't find tool you were looking for?