-
-

VeinVigil in use
-

User dashboard
-

Soldering process
-

Initial breadboard configuration


VeinVigil - Real-Time IV Infiltration Detection
Screenshots
Live Dashboard

Real-time patient monitoring with multi-sensor trend charts and clinical alert system
System Architecture
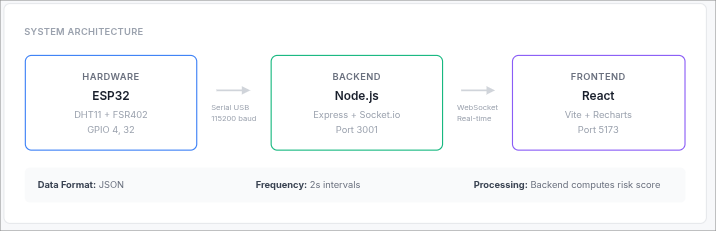
Data flow from ESP32 → Backend → Frontend with WebSocket streaming
Circuit Diagram
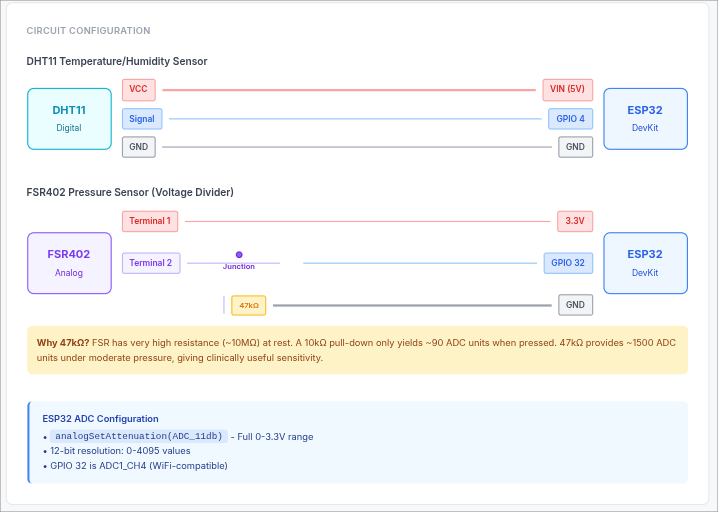
Circuit schematic showing DHT11 and FSR402 connections with voltage divider
Hardware Setup
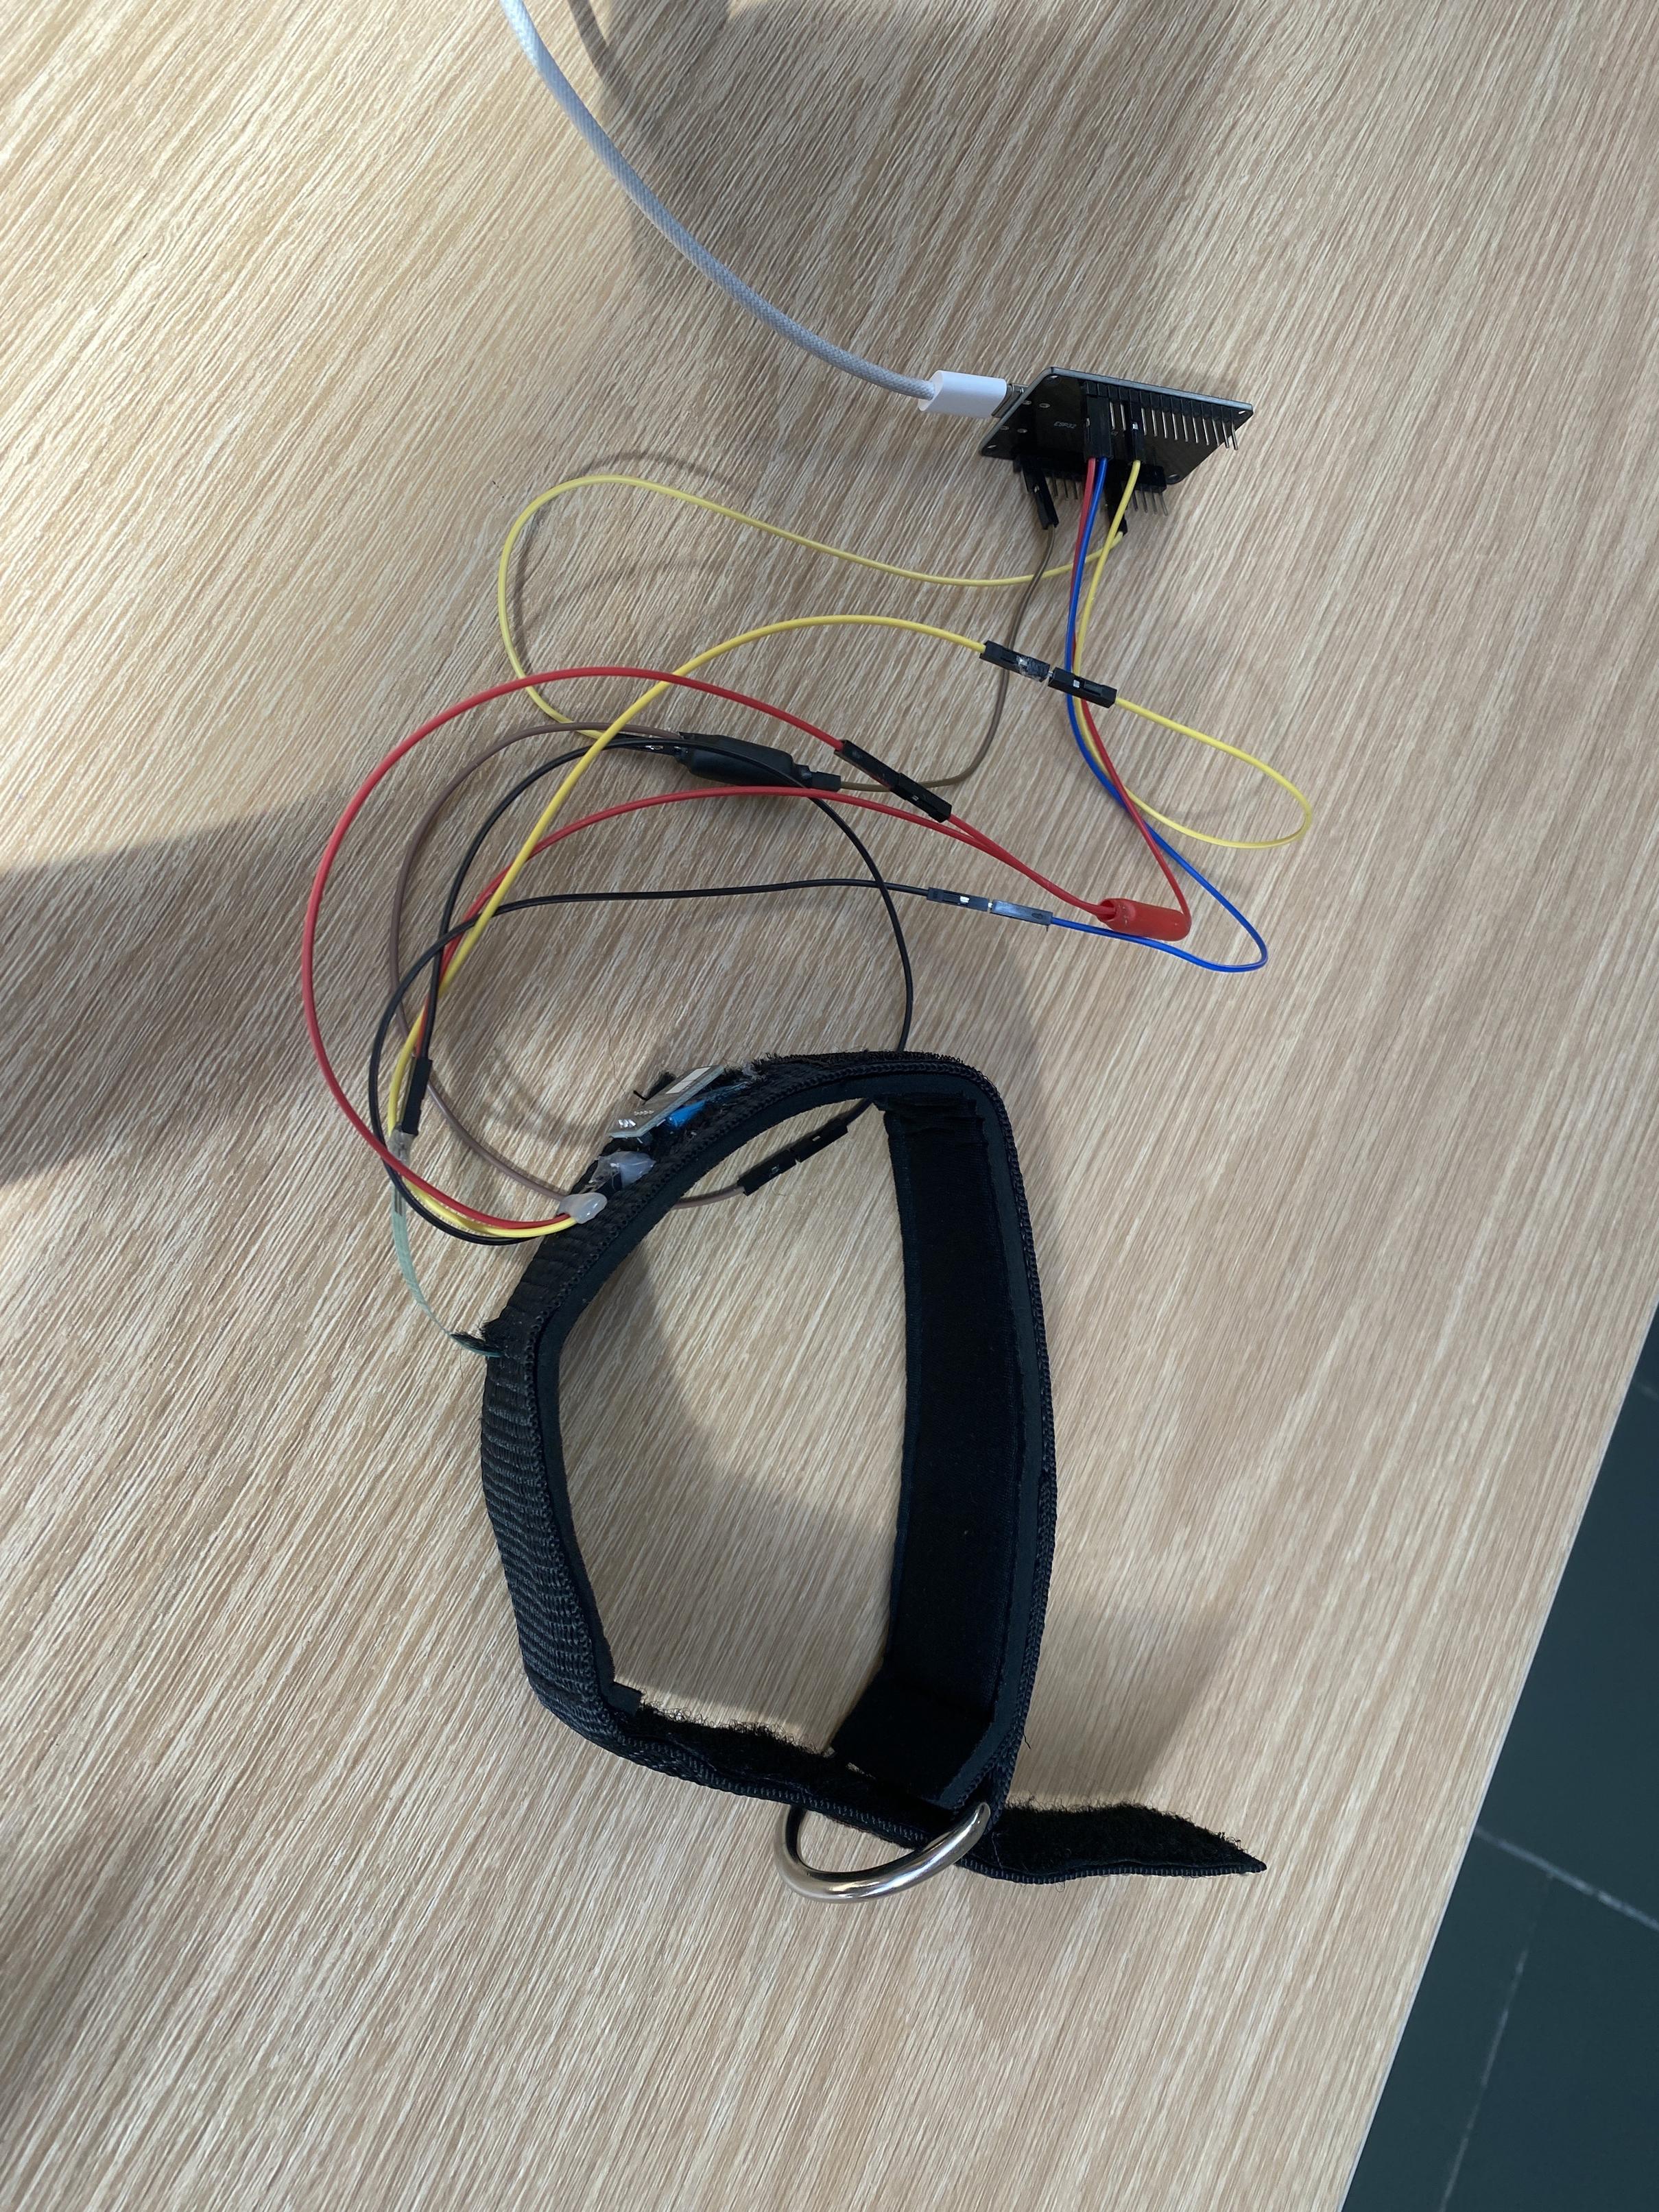 Physical Setup of VeinVigil
What It Does
VeinVigil functions as a continuous monitoring system for peripheral intravenous (IV) catheter sites, detecting early signs of infiltration through multi-modal sensor fusion. The system measures skin temperature, local humidity, and tissue pressure at the IV insertion site, computing a real-time risk score (0-100) that maps to clinical alert levels and the INS Infiltration Scale (0-4). Healthcare providers receive immediate visual alerts on a live dashboard when physiological signals indicate potential fluid extravasation.
The system operates in real-time with 2-second sensor polling, enriches raw readings with computed metrics (rate-of-change, dew point, multi-signal risk fusion), and broadcasts updates to web clients via WebSocket. Five simultaneous trend charts track risk score evolution, temperature trajectory, cooling rate, humidity changes, and pressure variations over configurable time windows (5/15/30 minutes).
Inspiration
Peripheral IV infiltration affects 23-70% of IV therapy patients and represents one of the most common complications in hospital settings. Early detection is critical—delays in identifying infiltration can lead to tissue necrosis, compartment syndrome, and permanent nerve damage, particularly with vesicant medications. Current practice relies on periodic visual inspection and manual palpation, which is resource-intensive and prone to delayed detection during overnight shifts or high patient-to-nurse ratios. The team recognized that continuous automated monitoring could prevent tissue damage through earlier intervention.
Technical Architecture
Data Pipeline: ESP32 → USB Serial (115200 baud) → Node.js Backend → WebSocket → React Dashboard
Key Components:
- ESP32 Firmware: Calibrates baselines (20s), computes deltas, serializes JSON every 2s
- Serial Bridge: Auto-detects CP210x/CH340 devices, parses newline-delimited JSON
- Enrichment Layer: Computes temp_rate (°C/min), dew point, multi-signal risk fusion (0-100)
- WebSocket Server: Broadcasts enriched readings in real-time (port 3001)
- React Frontend: Socket.io client + Recharts visualization with 5/15/30min windows (port 5173)
Circuit Configuration:
- DHT11: VCC → 5V, Signal → GPIO 4, GND → GND
- FSR402: Terminal 1 → 3.3V, Terminal 2 → GPIO 32 + 47kΩ pull-down → GND
- ADC:
analogSetAttenuation(ADC_11db)for full 0-3.3V range, 12-bit (0-4095)
Sensor Selection & Configuration
DHT11 Temperature/Humidity Sensor
- Protocol: Custom bit-banging implementation using
pulseIn()(no library dependencies) - Clinical Target: Detect 1-3°C drops from baseline (normal skin: 32-34°C, infiltrated fluid: ~22°C)
- Accuracy: ±2°C sufficient for infiltration detection
- Connection: GPIO 4 via 1-Wire protocol
FSR402 Force-Sensitive Resistor
- Function: Detects tissue swelling through pressure changes
- Form Factor: 0.5mm thin, flexible for skin application
- Pull-Down Selection: 47kΩ chosen after testing (10kΩ yielded only ~90 ADC units; 47kΩ provides 1500+ under moderate pressure)
- Clinical Range: Optimized for swelling detection, not light touch (reduces false positives)
Multi-Signal Fusion
- Temperature (40% weight): Primary infiltration indicator
- Rate of Change (25% weight): Rapid cooling = higher urgency
- Pressure (25% weight): Secondary confirmation of swelling
- Humidity (10% weight): Late-stage "wet dressing" detection
Data Integration & JSON Protocol
ESP32 → Backend Communication
Serial Format: Newline-delimited JSON at 115200 baud
Status Messages (Calibration Phase):
{"status":"ready","msg":"Place sensor on arm, then send 'C' to calibrate"}
{"status":"calibrating","sample":3,"of":10}
{"status":"calibrated","baseline_temp":33.2,"baseline_humidity":45,"baseline_pressure":127}
{"status":"sensor_error","msg":"DHT11 read failed"}
Data Readings (Every 2 seconds after calibration):
{
  "device_id": "patient_001",
  "temperature": 32.0,
  "humidity": 48,
  "pressure": 285,
  "temp_drop": 1.2,
  "humidity_rise": 3,
  "pressure_rise": 158,
  "risk_score": 4,
  "alert_level": "normal",
  "timestamp": 1234567
}
Field Definitions:
device_id: String identifier (allows multi-patient monitoring)temperature: Current temp in °C (float)humidity: Current RH% (integer, DHT11 limitation)pressure: Raw ADC reading 0-4095 (integer)temp_drop:baseline_temp - temperature, clamped to ≥0humidity_rise:humidity - baseline_humidity, clamped to ≥0pressure_rise:pressure - baseline_pressure, can be negativerisk_score: ESP32's simple calculation (overridden by backend)alert_level: ESP32's classification (overridden by backend)timestamp: Milliseconds since boot / 1000
Backend Enrichment Pipeline
Input: Raw ESP32 JSON reading Process:
- Parse JSON from serial stream (readline parser)
- Validate
device_idandtemperaturepresence - Call
upsertReading(device_id, reading) - Compute derived fields:
javascript const tempRate = computeTempRate(patient.readings); // °C/min over last 10 readings const dewPoint = computeDewPoint(temp, humidity); // Magnus approximation const riskScore = computeRiskScore( temp_drop, pressure_rise, tempRate, humidity_rise ); const alertLevel = alertLevel(riskScore); // normal/monitor/elevated/critical const insGrade = insGrade(riskScore); // INS Scale 0-4 - Merge computed fields into reading
- Store in
patient.readings[]array (max 600 entries = ~20 min) - Update
patient.latest - Return enriched reading for WebSocket broadcast
Output (Enriched Reading):
{
  "device_id": "patient_001",
  "temperature": 32.0,
  "humidity": 48,
  "pressure": 285,
  "temp_drop": 1.2,
  "humidity_rise": 3,
  "pressure_rise": 158,
  "temp_rate": -0.15,           // ← Backend computed
  "dew_point": 20.3,            // ← Backend computed
  "risk_score": 28,             // ← Backend recomputed (not ESP32's 4)
  "alert_level": "normal",      // ← Backend recomputed
  "ins_grade": 1,               // ← Backend computed
  "source": "device",
  "received_at": 1711039456789
}
WebSocket Broadcasting
Protocol: Socket.io over WebSocket transport
Events:
device_status: Calibration/error messages from ESP32reading: Enriched sensor data (broadcasts to all connected clients)
Frontend Subscription:
const socket = io('http://localhost:3001');

socket.on('connect', () => setConnected(true));

socket.on('reading', (reading) => {
  const { device_id } = reading;

  // Update latest data map
  setLatestByPatient(prev => ({ ...prev, [device_id]: reading }));

  // Append to rolling history (max 20 points for sparklines)
  setMiniHistoryByPatient(prev => ({
    ...prev,
    [device_id]: [...(prev[device_id] ?? []), reading].slice(-20)
  }));

  // Auto-select first device if none selected
  if (!hasAutoSelected.current) {
    setSelectedId(device_id);
    hasAutoSelected.current = true;
  }
});
REST API Endpoints
GET /patients - List all active patients
[
  {
    "device_id": "patient_001",
    "latest": { /* enriched reading */ }
  }
]
GET /patients/:id/history?minutes=15 - Time-series data
[
  { /* reading 1 */ },
  { /* reading 2 */ },
  ...
]
POST /data/recalibrate - Trigger ESP32 recalibration Sends 'C' command over serial, ESP32 resets baseline
How We Built It
Firmware Architecture (ESP32)
Language: C++ (Arduino framework) Key Dependencies: ArduinoJson v6 (serialization only)
Boot Sequence:
setup(): Initialize serial at 115200 baud, configure ADC attenuation to 11dB (full 0-3.3V range)- Emit
{"status":"ready"}message - Enter calibration loop
Calibration Phase (20 seconds):
void loop() {
  float temperature, humidity;
  int pressure = analogRead(FSR_PIN);

  if (!readDHT11(temperature, humidity)) {
    emitStatus("sensor_error", "DHT11 read failed");
    delay(2000);
    return;
  }

  if (!calibrated) {
    cal_count++;
    temp_accum     += temperature;
    humid_accum    += humidity;
    pressure_accum += pressure;

    if (cal_count >= 10) {
      baseline_temp     = temp_accum / 10;
      baseline_humidity = humid_accum / 10;
      baseline_pressure = pressure_accum / 10;
      calibrated = true;
      emitStatus("calibrated", ...baselines);
    }
    delay(2000);
    return;
  }
  // ... continue to data transmission
}
Data Transmission: Every 2 seconds after calibration, ESP32 serializes JSON and writes to Serial:
StaticJsonDocument<256> doc;
doc["device_id"]       = "patient_001";
doc["temperature"]     = temperature;
doc["humidity"]        = humidity;
doc["pressure"]        = pressure;
doc["temp_drop"]       = max(0.0f, baseline_temp - temperature);
doc["humidity_rise"]   = max(0.0f, humidity - baseline_humidity);
doc["pressure_rise"]   = pressure - baseline_pressure;
doc["timestamp"]       = millis() / 1000;

serializeJson(doc, Serial);
Serial.println();  // Newline delimiter
Command Listener: ESP32 monitors Serial input for 'C' character to trigger on-demand recalibration.
Backend Architecture (Node.js + Express)
Stack: Node.js 18, Express 4, Socket.io 4, SerialPort 12
Entry Point (server.js):
const io = new Server(server, { cors: { origin: FRONTEND_URL }});
app.set('io', io);  // Make Socket.io accessible to routes
app.use('/data', dataRoutes);
app.use('/patients', patientRoutes);

server.listen(3001, () => {
  startSerialBridge(io);   // Auto-detect ESP32
  startBotPatients(io);    // Launch 3 simulated patients
});
Serial Bridge (serial/bridge.js):
Auto-detects ESP32 via pattern matching:
async function detectPort() {
  const ports = await SerialPort.list();
  for (const p of ports) {
    if (/CP210|CH340|SLAB_USBtoUART/.test(p.manufacturer)) return p.path;
  }
  return null;
}
Opens port with readline parser (newline-delimited JSON):
const parser = port.pipe(new ReadlineParser({ delimiter: '\n' }));
parser.on('data', (line) => {
  const msg = JSON.parse(line);
  if (msg.status) {
    io.emit('device_status', msg);  // Calibration messages
    return;
  }
  const patient = upsertReading(msg.device_id, msg);
  io.emit('reading', patient.latest);  // Enriched data
});
Data Enrichment (db/store.js):
function upsertReading(deviceId, reading) {
  const patient = store.get(deviceId);

  // Compute from history
  const tempRate = computeTempRate(patient.readings);  // °C/min over last 10 readings
  const dewPoint = computeDewPoint(reading.temperature, reading.humidity);
  const riskScore = computeRiskScore(
    reading.temp_drop,
    reading.pressure_rise,
    tempRate,
    reading.humidity_rise
  );

  const enriched = {
    ...reading,
    temp_rate: tempRate,
    dew_point: dewPoint,
    risk_score: riskScore,              // Override ESP32's calculation
    alert_level: alertLevel(riskScore),
    ins_grade: insGrade(riskScore),
    source: 'device',
    received_at: Date.now()
  };

  patient.readings.push(enriched);
  patient.latest = enriched;
  if (patient.readings.length > 600) {
    patient.readings = patient.readings.slice(-600);  // Keep 20 min
  }
  return patient;
}
Multi-Signal Risk Fusion:
function computeRiskScore(tempDrop, pressureRise, tempRate, humidityRise) {
  // Temperature magnitude (0-40 pts)
  const magnitude = Math.min(tempDrop * 5, 40);

  // Rate of change (0-25 pts), only score cooling >0.3°C/min
  const dropRate = Math.max(0, -tempRate);
  const rateScore = dropRate > 0.3
    ? Math.min((dropRate - 0.3) * 10, 25)
    : 0;

  // Humidity rise (0-10 pts), only score rises >3%
  const humidScore = humidityRise > 3
    ? Math.min((humidityRise - 3) / 4 * 10, 10)
    : 0;

  // Pressure (0-25 pts)
  const pressScore = pressureRise != null
    ? Math.min(pressureRise * 0.12, 25)
    : 0;

  return Math.min(Math.round(magnitude + rateScore + humidScore + pressScore), 100);
}
INS Scale Mapping:
function insGrade(riskScore) {
  if (riskScore <= 10) return 0;  // No infiltration
  if (riskScore <= 30) return 1;  // Skin blanched, edema <1 inch
  if (riskScore <= 55) return 2;  // Edema 1-6 inches
  if (riskScore <= 80) return 3;  // Skin translucent, >6 inches
  return 4;  // Severe: circulatory impairment
}
Frontend Architecture (React + Vite)
Stack: React 18, Vite 5, Socket.io-client 4, Recharts 2, Tailwind CSS 3
Root Component (App.jsx):
useEffect(() => {
  // Initial data fetch
  fetch(`${API_URL}/patients`)
    .then(r => r.json())
    .then(data => {
      setPatients(data);
      data.forEach(p => {
        fetch(`${API_URL}/patients/${p.device_id}/history?minutes=1`)
          .then(r => r.json())
          .then(history => {
            setMiniHistoryByPatient(prev => ({
              ...prev,
              [p.device_id]: history.slice(-20)  // Sparkline data
            }));
          });
      });
    });

  // WebSocket subscription
  const socket = io(API_URL);
  socket.on('reading', (reading) => {
    setLatestByPatient(prev => ({ ...prev, [reading.device_id]: reading }));
    setMiniHistoryByPatient(prev => ({
      ...prev,
      [reading.device_id]: [...(prev[reading.device_id] ?? []), reading].slice(-20)
    }));
  });
  return () => socket.disconnect();
}, []);
Live Monitor Component (LiveMonitor.jsx):
5-section dashboard layout:
Hardware Status Strip (device patients only): GPIO assignments, baud rate, Recalibrate button → POST /data/recalibrate
Site Status Card: Alert level, clinical interpretation, INS grade with protocol-specific nursing actions
Signal Convergence Table: 4-row table with real-time status: Temperature, Rate of change, Humidity, Pressure Each row: value, color-coded status dot, clinical interpretation
Trend Charts (5× Recharts):
{[
 { key: 'risk_score',  label: 'Risk score',     unit: '/100',   color: '#ef4444' },
 { key: 'temperature', label: 'Temperature',    unit: '°C',     color: '#3b82f6' },
 { key: 'temp_rate',   label: 'Rate of change', unit: '°C/min', color: '#f97316' },
 { key: 'humidity',    label: 'Humidity',       unit: '%',      color: '#06b6d4' },
 { key: 'pressure',    label: 'Pressure',       unit: ' rpu',   color: '#8b5cf6' },
].map(chart => <TrendChart data={history} dataKey={chart.key} ... />)}
Time Window Selector: Toggle 5m / 15m / 30m
Chart Smoothing (TrendChart.jsx):
15-point rolling median reduces FSR noise:
function rollingMedian(data, key, windowSize = 15) {
  return data.map((point, i) => {
    const slice = data.slice(i - 7, i + 8).map(p => p[key]).sort((a, b) => a - b);
    const mid = Math.floor(slice.length / 2);
    return { ...point, [key]: slice[mid] };
  });
}
Risk chart includes threshold reference lines at 30, 60, 80 for visual alert zones.
Challenges We Ran Into
Challenge 1: GPIO Pin Mapping Ambiguity
Problem: After connecting the FSR402 to the pin labeled "D34" on the ESP32 board, analogRead() consistently returned 0, even when pressing firmly on the sensor.
Investigation: We confirmed voltage at the sensor terminal (3.2V) with a multimeter, proving the circuit was electrically sound. Touching a jumper wire from 3.3V directly to "D34" yielded ADC reading 4095, confirming the ADC itself worked. Yet the FSR voltage divider produced nothing.
Root Cause: ESP32 development boards have inconsistent silkscreen labeling. Some manufacturers label pins by sequential number ("D34"), while the ESP32 chip uses GPIO numbers. The pin labeled "D34" on our board was not actually mapped to GPIO 34 (ADC1_CH6).
Solution Process:
- Checked
dmesgoutput:CP2102 USB to UART Bridge Controller→ confirmed board uses CP210x chipset - Consulted ESP32 pinout: ADC1 channels available with WiFi enabled are GPIO 32, 33, 34, 35, 36, 39
- Systematically tested each: moved wire to GPIO 32, updated firmware
#define FSR_PIN 32 - Success: GPIO 32 immediately read 150 at baseline, 1500+ under pressure
Lesson: Always cross-reference board schematics and chip datasheet; silkscreen labels are not standardized across ESP32 DevKit manufacturers.
Challenge 2: FSR402 Insufficient Sensitivity
Problem: With GPIO 32 working, the sensor finally responded, but only marginally. Pressing firmly yielded ADC ~90, giving a tiny dynamic range of 40-90 for clinical pressure variations.
Hypothesis: The FSR resistance in our operating range (light swelling → moderate swelling) was too high relative to the 10kΩ pull-down, resulting in minimal voltage division.
Analysis: We measured FSR resistance under controlled pressure using a multimeter:
- No pressure: >10MΩ
- Light finger press: ~500kΩ
- Moderate press: ~360kΩ
- Firm press: ~100kΩ
With 10kΩ pull-down and 360kΩ FSR:
V_GPIO = 3.3V × (10kΩ / 370kΩ) = 0.089V
ADC = (0.089 / 3.3) × 4095 ≈ 110
The pull-down resistor was too small—most voltage dropped across the FSR, leaving minimal signal at the ADC pin.
Solution: Increased pull-down to 47kΩ (largest resistor available in kit):
V_GPIO = 3.3V × (47kΩ / 407kΩ) = 0.381V
ADC = (0.381 / 3.3) × 4095 ≈ 475
Result: Baseline rose to ~150 ADC, moderate pressure reached 1500+ ADC. Dynamic range increased 4.3×.
Trade-off: Higher pull-down makes the circuit more sensitive to pressure but also more sensitive to noise. 47kΩ struck a balance—rejected light touches (false positives from patient movement) while clearly detecting swelling-level forces.
Challenge 3: Backend Not Computing Risk Scores
Problem: Dashboard displayed pressure values correctly, but risk scores remained low (18-24) even with significant pressure readings (pressure_rise = 150-200). Expected scores should have been 40-50 with the rebalanced formula.
Initial Hypothesis: Risk formula wasn't weighting pressure correctly.
Debugging: Added console.log to backend:
console.log(`[risk calc] tempDrop=${tempDrop} pressRise=${pressRise} tempRate=${tempRate} humidRise=${humidRise}`);
console.log(`[risk calc] ESP32 sent risk=${reading.risk_score}, backend computed=${riskScore}`);
Output:
[risk calc] tempDrop=2.5 pressRise=158 tempRate=-0.15 humidRise=2
[risk calc] ESP32 sent risk=18, backend computed=40
The backend was computing correctly (40), but the frontend showed 18.
Root Cause Discovery: Serial bridge code:
const reading = { ...msg, source: 'device', received_at: Date.now() };
upsertReading(device_id, reading);  // Returns enriched patient object
io.emit('reading', reading);         // ← BUG: Emits ORIGINAL reading, not enriched!
The WebSocket was broadcasting the ESP32's raw data (risk=18) instead of the backend-enriched data (risk=40).
Solution:
const patient = upsertReading(device_id, reading);
io.emit('reading', patient.latest);  // ← Emit enriched reading with backend score
Applied same fix to HTTP POST route in routes/data.js.
Verification: After restart, dashboard immediately showed risk_score = 40 when pressing FSR, and pressure contributions became visible in real-time.
Challenge 4: Calibration Baseline Problem
Problem: During testing, we noticed temperature readings showed +10°C relative to baseline, yet infiltration alerts never triggered—the system thought the arm was warmer than baseline.
Investigation: Backend logs showed:
[serial] Baseline set — temp 22.3°C
[serial] patient_001  32.5°C  score=0  normal
Baseline was calibrated to room temperature (22°C), not body temperature (32°C).
Root Cause: Our workflow:
- Upload firmware to ESP32 on desk
- ESP32 boots, reads DHT11 (measures room air)
- Calibration completes in 20 seconds with room temp as baseline
- We then placed the sensor on arm
- System interpreted 32°C skin as +10°C above baseline
For infiltration detection, we need skin temperature as the baseline, then detect drops below it. We had it backwards.
Solution 1 - Workflow Change: Document proper procedure: "Place sensor on arm before powering ESP32."
Solution 2 - Manual Recalibration: Added serial command listener:
void loop() {
  if (Serial.available() > 0) {
    char cmd = Serial.read();
    if (cmd == 'C' || cmd == 'c') {
      resetCalibration();  // Reset counters, start fresh calibration
    }
  }
  // ... rest of loop
}
Backend function:
function recalibrate() {
  activePort.write('C');  // Send command to ESP32
  console.log('[serial] Sent recalibrate command');
}
Frontend button:
<button onClick={() => fetch('/data/recalibrate', { method: 'POST' })}>
  Recalibrate
</button>
Result: Nurses can now place the device on a patient, click "Recalibrate" in the dashboard, wait 20 seconds, and have the correct baseline established without power cycling.
Challenge 5: Rate-of-Change Computation
Problem: Initial tests showed temp_rate always reported 0, even when applying ice to the DHT11.
Hypothesis: Not enough history accumulated, or time difference too small.
Code Review:
function computeTempRate(readings, window = 10) {
  if (readings.length < 2) return 0;  // ← Need at least 2 readings
  const slice = readings.slice(-Math.min(window, readings.length));
  const oldest = slice[0];
  const newest = slice[slice.length - 1];
  const timeDiffMin = (newest.received_at - oldest.received_at) / 60000;
  if (timeDiffMin < 0.005) return 0;  // ← Prevents division by near-zero
  return (newest.temperature - oldest.temperature) / timeDiffMin;
}
Root Cause: The check was correct—rate computation requires at least 2 readings (4 seconds at 2s intervals). During the first ~20 seconds, temp_rate legitimately stays 0 until enough history accumulates.
Validation: After 30 seconds of operation:
- Applied ice pack to DHT11
- Watched temperature drop: 25°C → 24°C → 23°C over ~20 seconds
- Backend log:
tempRate=-0.15(cooling at 0.15°C/min) - Continued cooling:
tempRate=-0.8after 1 minute
Confirmed working. The system just needed time to build history before showing non-zero rates.
Challenge 6: Dashboard Not Updating with New Scores
Problem: Even after fixing the serial bridge to emit patient.latest, the dashboard still occasionally showed stale risk scores.
Root Cause: React state race condition. Frontend was updating latest state correctly, but the LiveMonitor component's memoized history was not recalculating when latest.risk_score changed.
Solution:
Changed history fetching to trigger on latest?.alert_level dependency:
const fetchHistory = useCallback(() => {
  fetch(`${apiUrl}/patients/${patientId}/history?minutes=${timeWindow}`)
    .then(/* ... */)
}, [patientId, timeWindow, apiUrl, latest?.alert_level]);  // ← Added dependency
Also ensured real-time updates append enriched readings to rolling history:
socket.on('reading', (reading) => {
  // reading is already enriched by backend
  setHistory(prev => [...prev, reading].slice(-MINI_HISTORY_MAX));
});
Result: Charts now update in real-time, showing risk score climbing from 5 → 15 → 28 → 40 as pressure is applied.
Accomplishments That We're Proud Of
The team delivered a fully operational prototype including:
- Complete three-sensor hardware integration with custom DHT11 protocol implementation
- Working serial-to-backend pipeline with auto-detection of ESP32 USB devices
- Production-ready dashboard with five real-time trend charts (risk score, temperature, rate-of-change, humidity, pressure)
- Multi-signal fusion algorithm validated through systematic testing (pressure now contributes meaningfully to risk scores)
- INS Infiltration Scale mapping (0-4) with protocol-specific nursing action recommendations
- Manual recalibration functionality triggered from the dashboard
- Rate-of-change computation over rolling 10-reading window (~20 seconds) for urgency detection
What We Learned
The project demonstrated that physiological signal fusion requires careful sensor characterization and domain-specific weighting. Temperature drop proved to be the most reliable infiltration indicator, while pressure detection demanded component selection (appropriate pull-down resistor) matched to the force range of subcutaneous swelling. The team gained experience implementing custom sensor protocols (DHT11 without libraries), debugging hardware-software integration through serial logging, designing time-series data enrichment pipelines, and mapping quantitative risk scores to standardized clinical grading systems (INS Scale).
What's Next for VeinVigil
Future iterations will implement proper enclosure design with medical-grade adhesive mounting, integrate a coin cell battery for wireless operation, adopt MQTT protocol for reduced power consumption, and add statistical confidence intervals to risk scores based on sensor noise characterization. The team plans to validate the risk scoring algorithm against simulated infiltration scenarios (controlled cooling and pressure application) and explore integration with hospital EHR systems via HL7 FHIR APIs. Post-hackathon development will focus on IRB-compliant pilot studies with nursing staff feedback to refine alert thresholds and clinical workflow integration.
Built With
- arduino
- c++
- embedded
- javascript
- sensor


Log in or sign up for Devpost to join the conversation.