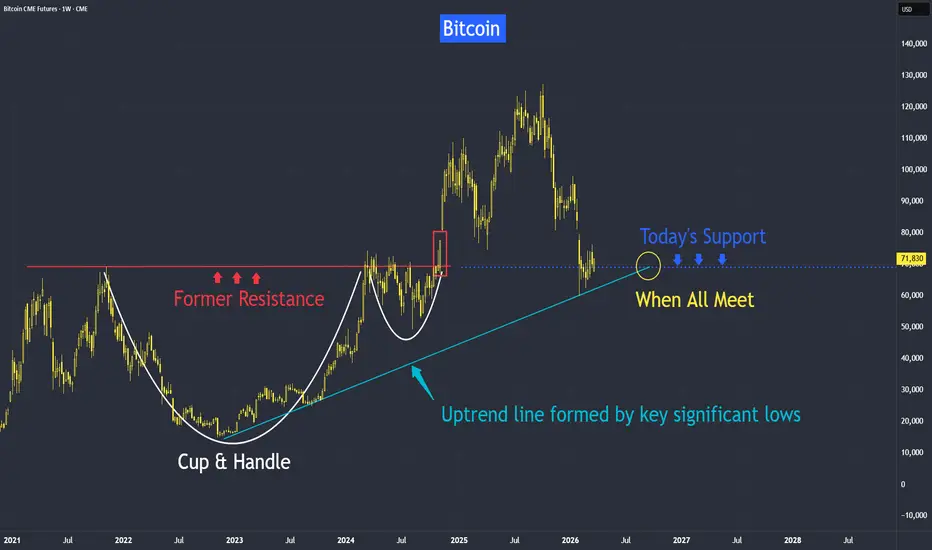
Bitcoin Key Support Level at 70,000It has fallen from last year's highs, but technical support could be near, and also supported by several fundamental factors.
Let me first touch on two key fundamentals before covering the technical aspects.
1) Regulator creating a friendlier environment - with new SEC rules and upcoming legislati

The best trades require research, then commitment.
Get started for free$0 forever, no credit card needed

Scott "Kidd" PoteetPolaris Dawn astronaut

Where the world does markets
Join 100 million traders and investors taking the future into their own hands.
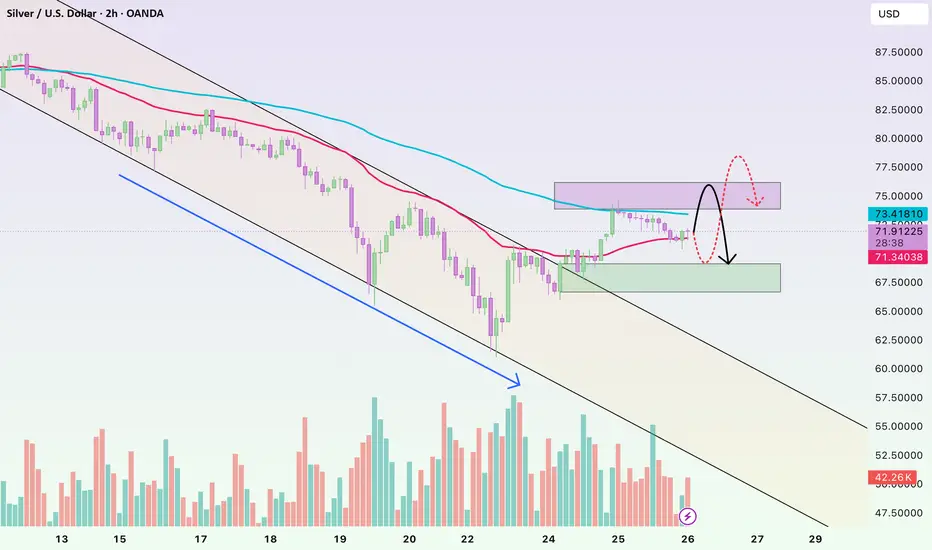
Silver Analysis: Which Direction Is Next?Before anything else, it’s important to note that silver, unlike gold, tends to have sharp and aggressive corrective moves. This makes it a bit more challenging to trade, so proper risk management and caution are essential when dealing with it.
From the point where we placed the red arrow on the ch

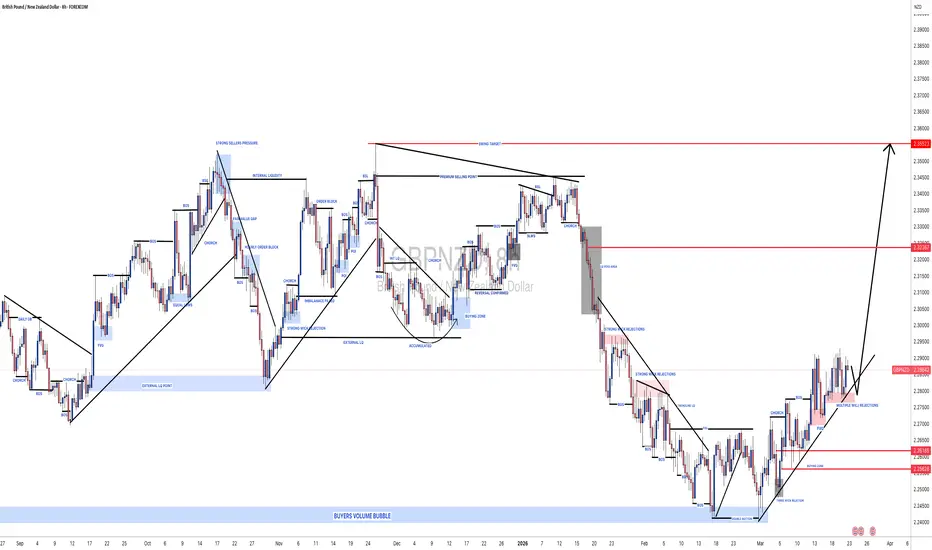
#GBPNZD: Two Targets, Once Strong Bullish Entry! ✴️ The GBP/NZD pair demonstrated a favourable reversal upon reaching our designated buying zone at 2.256, currently trading at 2.287. This indicates potential for continued upward momentum. We anticipate the price may advance towards the 2.32 level where a liquidity void is expected to be addressed.
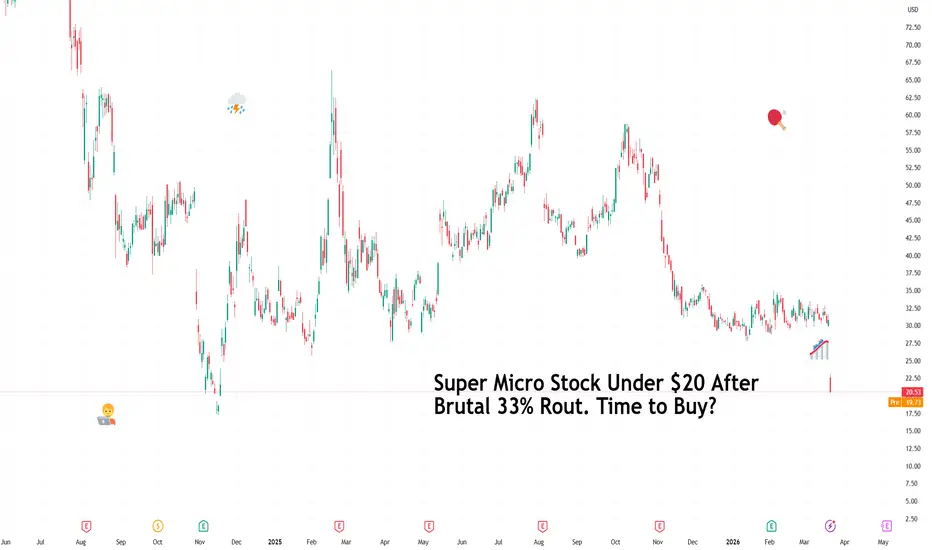
Super Micro Stock Under $20 After Brutal 33% Rout. Time to Buy?If only there was a way to track where things went wrong.
The board of directors at Super Micro NASDAQ:SMCI got together one day in the boardroom and decided it’s a good idea to bring back the same executive who had already resigned once over an accounting scandal.
They voted to hire him as a
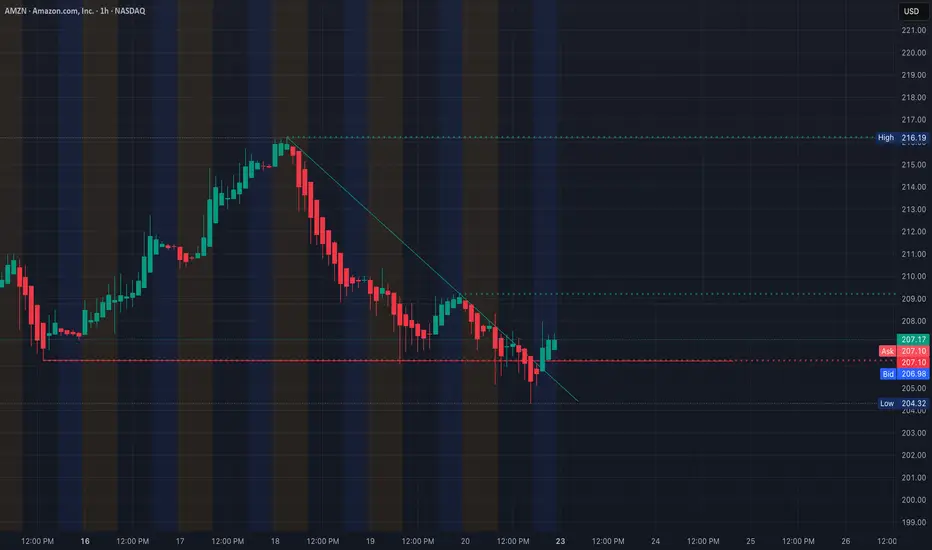
AMZN Holding Range - Waiting for Direction. Mar. 23Looking at AMZN right now, price is coming off a selloff but starting to stabilize around the 205–207 area.
This looks like a base forming, but it’s still sitting right under a key resistance zone.
1H Structure - Downtrend Trying to Slow
On the 1H chart, AMZN has been trending lower with consistent
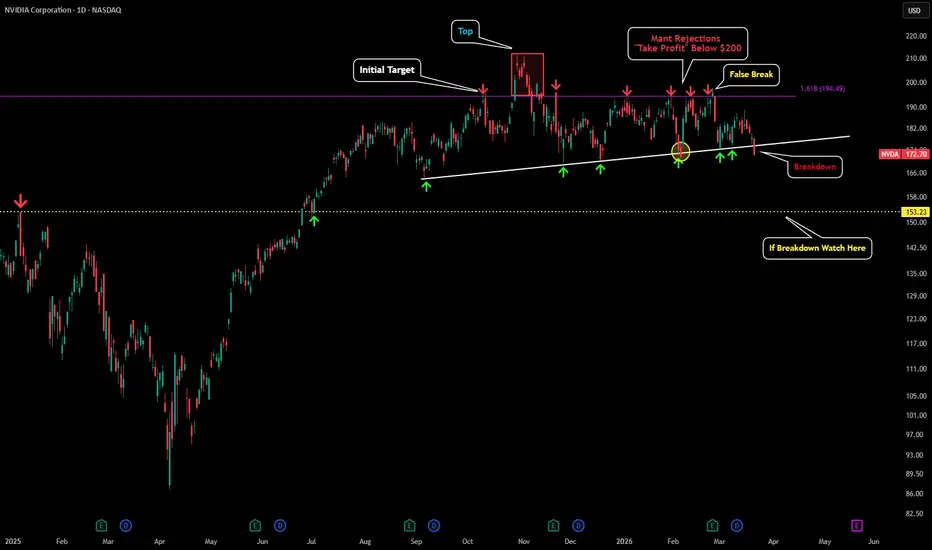
NVDA - On Verge of Breakdown This is an update to my last post:
I have been monitoring this trendline for quite some time, and with Friday's close, NVDA has broken below a trendline it has been holding for the past six to seven months which is a significant development.
It is possible for NVDA to reclaim this trendline on Mo
Bitcoin | We Are Officially In Bear MarketThe structure of Bitcoin is telling us just one thing: we are going to keep moving to lower zones from here on; we are in a bear phase of the markets.
Now saying that we are in bear markets is a little extreme, some might say but let's face the facts here: this bull market we had was never suppose
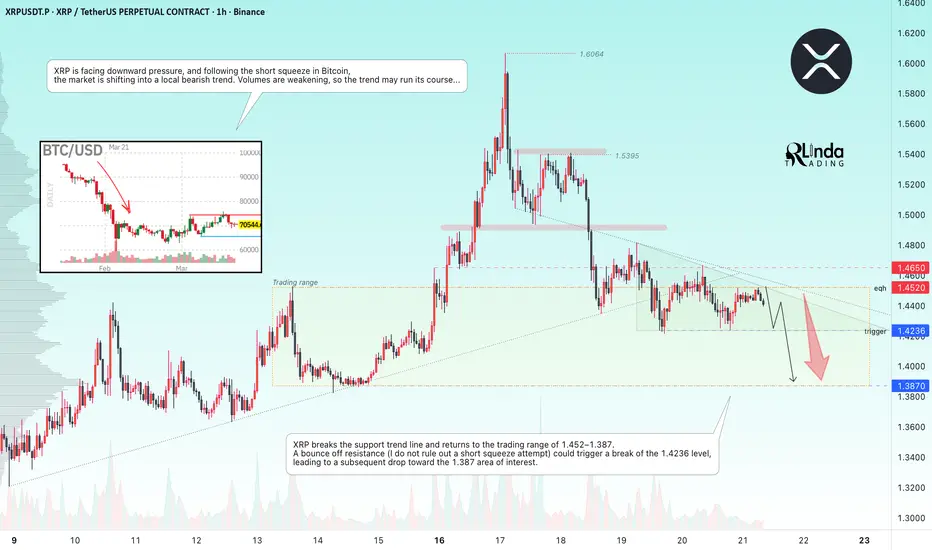
XRPUSDT - A break in the uptrend. Are we heading toward 1.380?BINANCE:XRPUSDT has broken through the uptrend support and is consolidating below 1.450, indicating that the market is poised to head toward support. Crypto winter continues...
XRP is facing downward pressure, and following a short squeeze in Bitcoin, the market is shifting into a local bearis
ENS is following a bearish structure (2H)We have a bearish CH after the formation of a swing high (SWH), followed by a well-respected bearish structure with multiple bearish BOS.
A large liquidity pool has formed below the current price for some time, and it is expected to be taken soon, leading to further downside.
We are looking for se

SPY:A mostly fundamental discussionHey everyone,
Here are my thoughts on SPY.
Mostly focusing on the significance of the fundamentals currently.
The article I show with the EMA stats is here:
And I forgot to share the weekly forecast which is here:
Thanks for watching and safe trades everyone!

See all editors' picks ideas
TASC 2026.04 A Synthetic Oscillator█ Overview
This script implements a Synthetic Oscillator as presented by John F. Ehlers in the April 2026 TASC Traders' Tips article "Avoiding Whipsaw Trades". The indicator aims to provide a smooth, low-lag oscillator for timely trading signals by dynamically mapping a sine wave to price data
Pine Script® indicator

Volume Spread Analysis IQ [TradingIQ]Hello Traders!
🔹Volume Spread Analysis IQ
This indicator was most voted on for our indicator competition - so here it is! Hope you guys like it :D
Volume Spread Analysis IQ is a chart-reading tool built to help traders judge effort, result, and background context in a way that is visual and
Pine Script® indicator

Market Microstructure AnalyticsThe Hidden Toll on Every Trade
Every time you buy or sell a financial instrument, you pay a cost that never appears on your brokerage statement. It is not a commission. It is not a fee. It is the spread between the price at which someone is willing to sell to you and the price at which someone is
Pine Script® indicator

Fair Value Gap Profile + Rolling POC [BigBeluga]🔵 OVERVIEW
FVG Profile builds a price-level profile based on detected Fair Value Gaps (FVGs) over a fixed lookback period.
Instead of measuring traded volume alone, this tool aggregates bullish and bearish FVG occurrences into horizontal bins, allowing traders to see where price inefficienci
Pine Script® indicator

PineScript integration with Notepad++ (UDL)THIS IS NOT AN INDICATOR!
This is PineScript integration with Notepad++ text editor (NPP). It supports PineScript v6 as of January 2026. Provides autocompletion, function list and syntax highlighting for *.pine files.
Why would anyone need this?
Pine Editor doesn't provide function list yet
Pi
Pine Script® indicator

Machine Learning Pivot Points (KNN) [SS]Hey everyone,
Been working on this one for a very long time.
1. What It Is: The Geometric DNA of a Pivot
Machine Learning Pivot Points (KNN) is a predictive structural tool that moves away from traditional lag based oscillators. Instead of waiting for a moving average crossover, this system t
Pine Script® indicator

Market Structure Volume Profiles [Kioseff Trading]Hello traders and friends!
Introducing: "Market Structure Volume Profiles".
This script combines market structure with volume profiling and CVD to show how volume develops inside each structural changes of the market.
Instead of building one continuous profile across a session, this script create
Pine Script® indicator

Liquidity Thermal Map [BigBeluga]🔵 OVERVIEW
Liquidity Thermal Map visualizes where the highest traded volume has accumulated across price levels over a fixed lookback period.
Instead of plotting classic volume profiles with bars, the indicator builds a horizontal thermal heatmap directly on the chart, highlighting areas of
Pine Script® indicator

VIX Curve Pro - Real-Time Term Structure with StatisticsThis indicator displays the VIX term structure as a spatial curve directly on the chart, allowing you to instantly identify whether the volatility market is in contango or backwardation.
It shows the relationship between different VIX maturities (9D, 30D, 3M, 6M, 1Y) as a single curve.
It also sh
Pine Script® indicator

Stop Loss Cascades (Breakouts) [Kioseff Trading]Hello friends and traders!
🔹Introduction
This indicator " Stop-Loss Clustering (Breakouts) " attempts to model trader stop-loss placement logic and identify price areas where a large amount of stop losses might cluster.
The idea is, if stop losses are indeed highly concentrated in a specific are
Pine Script® indicator

See all indicators and strategies
Community trends
Meta - Setting up for a textbook swingtrade!Meta ( NASDAQ:META ) is soon approaching clear support:
🔎Analysis summary:
Over the course of the past couple of months, Meta has been dropping about -25%. But following this expected drop, Meta is also starting to approaching a significant support area. If we see the retest and confirmation,

Entry Confirmations - Asking the important questionWhat we must always ask is simple:
At what point did buyers or sellers fail to do what they were trying to do?
That’s the foundation of confirmation.
Without that, we find ourselves either entering too early, late, or being completely wrong.
Our rules aren’t there to hold us back - they’re bu

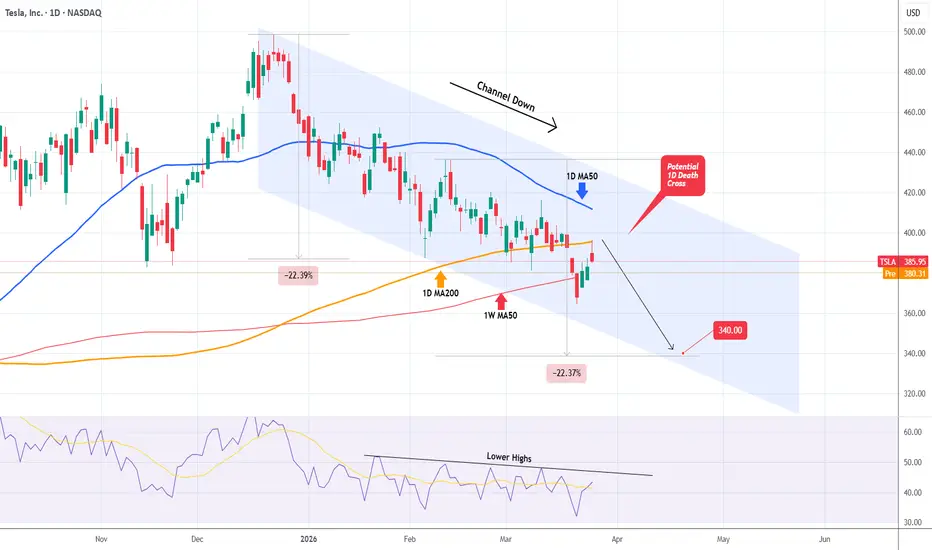
TESLA completely lost its 1D MA200. Instant drop highly probableTesla (TSLA) has been trading within a 3-month Channel Down, having turned early on the 1D MA50 (blue trend-line) to its Resistance. Since last Thursday, it also lost its 1D MA200 (orange trend-line) and the 1W MA50 (red trend-line), which was the long-term Support.
Ahead of a 1D Death Cross, with
RIOT still bullish!NASDAQ:RIOT is performing well considering the broader market and Bitcoin sell off. It remains just above the weekly 200EMA and pivot showing bulls in control.
Price remains above the channel breakout after tapping it as support, leaving a long lower wick at 0.5 Fib retracement, which is what bull

AMD GEX - Chip maker rally🔶 AMD – Breakout Attempt Toward 220 Call Wall in a Strong Sector Move 🔶
AMD is currently showing strong momentum as the entire semiconductor sector pushes higher, supported by positive headlines and continued strength in NVDA.
Price is breaking out aggressively and now approaching a key options-dr

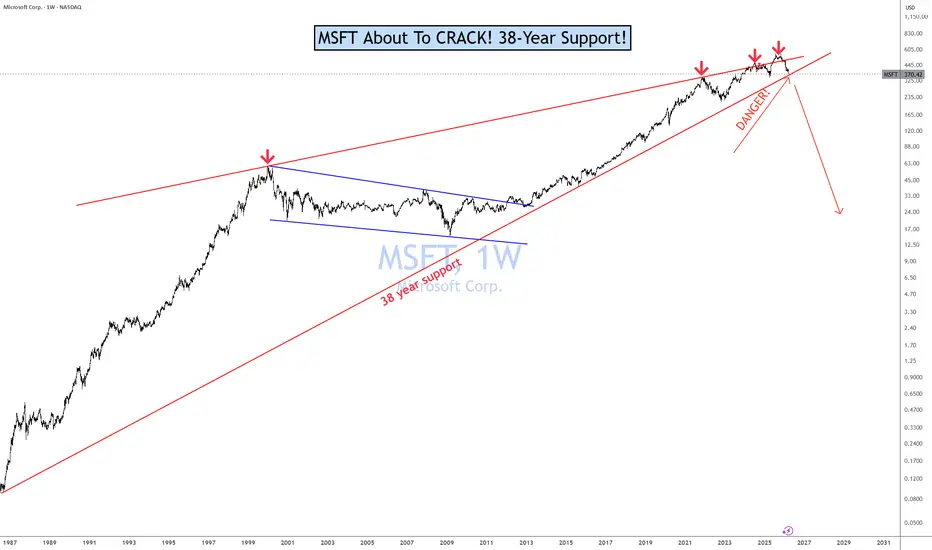
MSFT DANGER! UPDATEThis is BAD JUJU!! For the overall Market!
A 38-year support is about to give out on one of the most important stocks in the world after a -33% decline that has nothing to do with oil or the war. I mean "excursion." Sorry.
I have been warning about MSFT since Oct 2024.
Pumpers & experts love
I just can't wait any longer -- long MU here at 366.73 intradayI know all the arguments against this right now, AI bubble (then why is ARM up after announcing their new AI chip?), new MU supply coming online (their own - in 6 months, which should add revenue since they can't make memory fast enough now), looming recession (a recession is the single largest valu

$META,hope u fastened your seatbelt when I warned you 6 days agoNASDAQ:META , hope you fastened your seatbelt when I warned you 6 days ago.
Never had any doubt on this one.

INTEL; Heikin Ashi Trade Idea📈 Hey Traders!
Here’s a fresh outlook from my trading desk. If you’ve been following me for a while, you already know my approach:
🧩 I trade Supply & Demand zones using Heikin Ashi chart on the 4H timeframe.
🧠 I keep it mechanical and clean — no messy charts, no guessing games.
❌ No trendlines, no

$BABA ThesisAlibaba (BABA) — Investment Thesis Deep Dive
1. Current Setup (Why Now)
NYSE:BABA has corrected ~25–30% from recent highs and is now consolidating around the $120–130 range, sitting near key multi-month support.
This creates a classic dislocation setup:
• Sentiment still depressed (China risk

See all stocks ideas
Mar 26
LMRILumexa Imaging Holdings, Inc.
Actual
−0.38
USD
Estimate
0.05
USD
Mar 26
XXII22nd Century Group, Inc
Actual
−5.89
USD
Estimate
−2.10
USD
Mar 26
RMTIRockwell Medical, Inc.
Actual
−0.01
USD
Estimate
0.02
USD
Mar 26
SCVLShoe Carnival, Inc.
Actual
0.33
USD
Estimate
0.33
USD
Mar 26
CMCCommercial Metals Company
Actual
1.16
USD
Estimate
1.28
USD
Mar 26
DBIDesigner Brands Inc.
Actual
−0.31
USD
Estimate
−0.50
USD
Mar 26
HYPDHyperion DeFi, Inc.
Actual
−6.29
USD
Estimate
−1.57
USD
Mar 26
LOVEThe Lovesac Company
Actual
2.19
USD
Estimate
1.99
USD
See more events
Community trends
BTCUSDT: Consolidation Ends - Breakout Scenario in PlayHello everyone, here is my breakdown of the current BTCUSDT setup.
Market Analysis
BTCUSDT previously traded in a consolidation range, followed by multiple breakout attempts, confirming increased volatility and active participation from both buyers and sellers. After the breakout, price started f

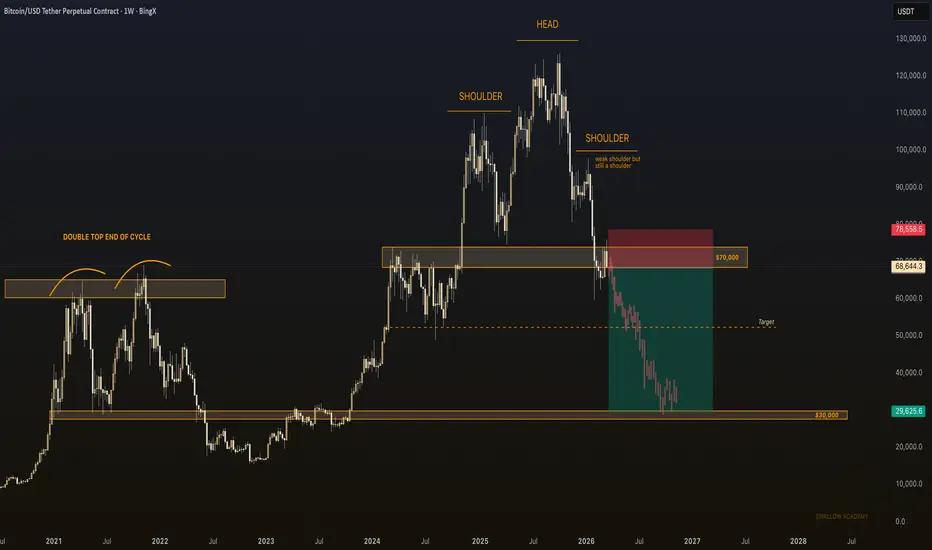
Capitulation event and a price tag of $30,000 —BitcoinI wasn't the only one, many people noticed the similarities between this cycle and 2018. A blow-off top with a crash that ended in early February. Eery similarities I should say.
Back in 2018, the market went sideways for months. Failing to move any higher, failing to recover, after eight months we

Bitcoin’s Next Move? Market Maker Plan?This analysis is an updated version, which you can find in the related releases section.
In the previous analysis, we identified a supply zone, but the price didn’t reach it and got rejected. That supply zone is still valid, and in this analysis, we haven’t changed it.
If the price reaches this su

BITCOIN - The bears held the 72K resistance level. Rebound BINANCE:BTCUSDT.P currently appears stable amid the chaotic market for indices, metals, and energy resources. Is this a hedge asset?
Bitcoin is bouncing off the 72K resistance level, and the market continues to keep the flagship asset in a downtrend. However, globally, Bitcoin looks fairly st

Bitcoin Preparing for Possible Upside SurgeThe chart shows Bitcoin trading within a descending channel after a strong bullish rally 📊. Price has respected the highlighted support zone multiple times, forming higher lows and signaling growing buyer strength. Currently, price is consolidating near mid-range resistance with small rejection wick
BITCOIN This secret sequence of Channels unlocks the Cycle codeBitcoin (BTCUSD) is technically half-way through its Bear Cycle by all known metrics, both in terms of price and time. What we haven't shown you yet (actually we have published this thesis 6-7 years ago and it's since been forgotten) is the underlying Channel Up approach on a Cycle horizon that has

Expanding Megaphone Structure Hinting at Explosive BTC MoveBTC is forming a Bullish Megaphone Pattern, signaling expanding volatility with higher highs and higher lows, a classic setup before a major impulsive move.
After sweeping the lower boundary, price is now reclaiming strength and pushing back into the structure. This shift hints at buyers stepping i

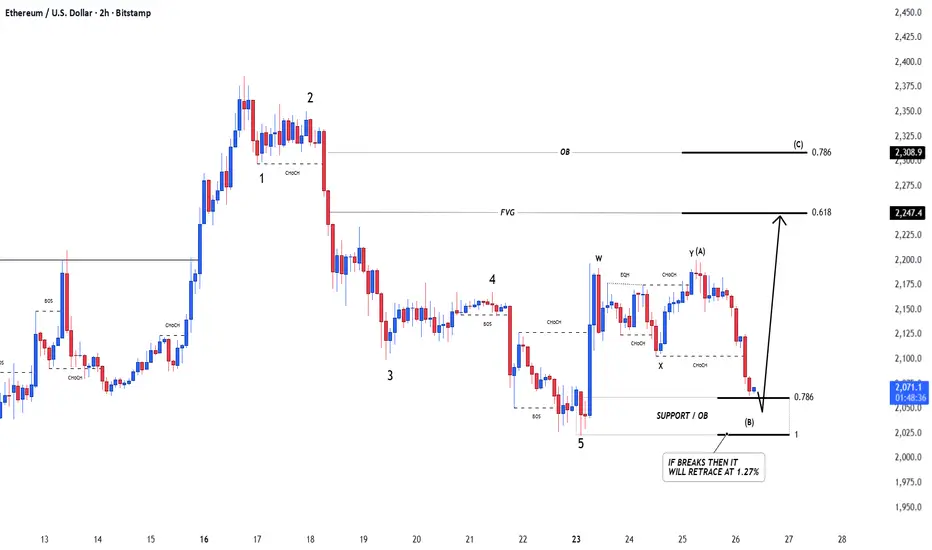
EthereumETHUSD
- Order Block
- Completed " 12345 " Impulsive Waves and " A " Corrective Waves
- Fair Value Gap
- Fibonacci Level - 78.60% / 100.00%
- Consolidation Phase
Bitcoin Looking selling in short-term PatternBTC is currently in a decision phase. The market is waiting for a breakout from this consolidation range. Traders should watch the key levels closely, as a confirmed breakout (either side) will likely define the next strong move.
Tecnically BTC Price recently tested the upper resistance area but fa

BTC Roadmap: 48K-54K First, Then New ATHsYou can see previous CHOCH clearly — every time market changed its structure, it respected the structure and gave a strong move in that direction.
Now again, same setup is forming on HTF 📉
After a strong bullish rally, BTC is showing weakness with lower highs and a fresh CHOCH, which clearly indic

See all crypto ideas
XAUUSD Bounce from Buyer Zone Signals Potential Move to 4,670Hello traders! Here’s my technical outlook based on the current XAUUSD (3H) chart structure. Gold previously moved inside an ascending channel, forming higher highs and higher lows until reaching the upper boundary, where price showed a clear rejection and reversed. Currently, XAUUSD broke below the

Gold 30Min Engaged ( Bearish Entry Detected )
⚡Base : Hanzo Trading Alpha Algorithm
The algorithm calculates volatility displacement vs liquidity recovery, identifying where probability meets imbalance.
It trades only where precision, volume, and manipulation intersect —only logic.
✈️ Technical Reasons
/ Direction — SHORT / Reversal 4564 Area

XAU/USD | What's ahead? (READ THE CAPTION)Gold dropped from 4602 to 4415 since yesterday morning, fell below the March 23rd NWOG and above March 24th NDOG, being traded at 4432 for now.
Currently, I'd like to see gold sweep the liquidity below the 4415 level, and reach the March 24th NDOG high and then bounce back up to retest the March 23

XAUUSD(GOLD): Two Take Profit Targets, Two Entries! ✴️ Gold has transitioned from a consolidation phase at $4400 to its current trading value of $4560, which we identify as a strategic entry point for swing trading XAU. We project a continued bullish trend, with a target of $5000 as our ultimate swing objective.
✴️ Two distinct buying opportunities

Post-Breakout Correction Before Continuation Toward HTF SupplyXAUUSD — Post-Breakout Correction Before Continuation Toward HTF Supply
1. Macro Catalyst Layer
Primary driver: Market transitioned from compression to expansion after triangle breakout → now entering corrective phase.
USD Channel: Dollar remains relatively firm → limits aggressive continuat

Lingrid | GOLD Structure Suggests Continuation Pattern May Form💬 Structure: breakdown from prior compression → transition into a major downward channel → current corrective rebound.
The current price action shows a corrective rebound, likely forming a continuation structure as price approaches a resistance confluence.
📌 Key levels
Resistance: 4,680–4,700
Supp

XAUUSD Facing Resistance – Potential Drop Towards SupportGold (XAUUSD) is currently trading inside a short-term consolidation after a strong bearish move. Price has already shown multiple breakout attempts, but momentum is weakening near a key resistance zone.
🔍 Key Observations:
Strong bearish structure formed after multiple breakdowns.
Price is now re

GOLD Price Update – Clean & Clear ExplanationGold is currently trading around 4558, showing signs of consolidation after a strong bullish impulse move. The market structure remains overall bullish, but price is now slowing down near a key resistance zone.
Key Observations:
Strong Bullish Breakout:
Price recently made a sharp upward move, bre

Silver Approaches Resistance While Downtrend Remains in ControlHello everyone,
On the H2 timeframe, Silver continues to trade within a well-defined descending channel, with a clear structure of lower highs and price remaining below key moving averages. The recent rebound has pushed price back into the 73–75 zone, which aligns with the upper boundary of the ch
XAUUSD Bullish Trendline Breakout with Continuation Setup
Gold is showing a strong bullish structure after forming a higher low near the trendline and breaking out of the consolidation zone (orange box). Price respected the ascending trendline and gained momentum, pushing into a new demand zone (blue area). Currently, the market is consolidating above sup

See all futures ideas
EURUSD Short: Descending Trend Holds - Breakdown 1.1550 in FocusHello traders! Here’s my technical outlook based on the current EURUSD (4H) chart structure. EURUSD previously traded inside a descending channel, forming consistent lower highs and lower lows, confirming sustained bearish pressure. After a breakout from the channel, price made a strong impulsive mo

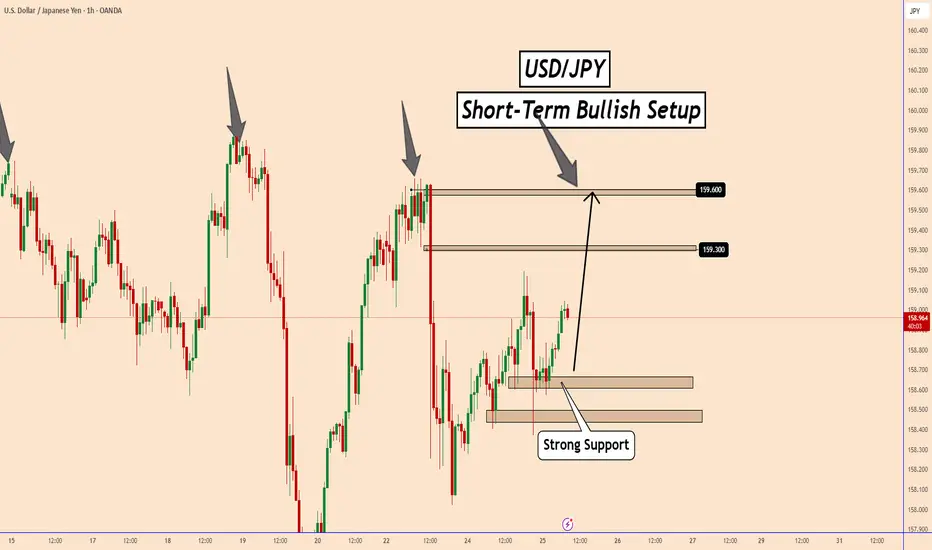
USDJPY Bullish Structure Intact, Retest of Highs LikelyUSDJPY Bullish Structure Intact, Retest of Highs Likely
USDJPY found strong support near 158.40 and later near 159.60
Price continues to respect the uptrend for now.
USDJPY is more likely to rise in the short term to once again test the uptrend top near 159.30 and 159.60.
It's possible that USD
EUR/USD Price Action Analysis – Key Support and Resistance LevelThis chart provides a detailed analysis of EUR/USD price action, highlighting critical support and resistance levels. The Key Resistance Level at 1.20380 USD is a major area where price could face strong rejection. The Minor Resistance at 1.19214 USD is another level to watch for potential price rev

EURUSD Losing Strength – Sellers Targeting 1.1400 ? (26.03.2026)🚨 Market Situation OANDA:EURUSD
EURUSD is currently trading inside a rising channel, but price is starting to lose bullish momentum near resistance.
The market is struggling to push higher, signaling a possible trend exhaustion.
💡 This could turn into a bearish breakdown setup if support fails.

EURUSD Price Update – Clean & Clear ExplanationEUR/USD pair is currently trading inside a sideways consolidation range, showing indecision after recent volatility. Price action indicates a balance between buyers and sellers, with no strong trend confirmed yet.
EURUSD Price recently attempted an upward move but failed to break higher resistance,

GBP/CAD | COT and Structure Still Favor a Bearish ContinuationOn the daily chart, GBPCAD remains in a clear bearish structure. After the sharp March selloff, price reacted from the 1.80–1.81 demand zone and is now retracing higher, but I still view this move as corrective rather than a true reversal. Price is currently testing a daily fair value gap around 1.8

USDCHF Weekly CLS Model 2 New CLS range created and Im looking for Short Model 1 trade setup. As always after the manipulation above the CLS range and reaction from the key level. We need to see confirmation switch from the manipulation phase - CIOD (change in order flow).
⏳ Stay patient and enter only after candle close.

EURUSD Fails at Resistance - Downtrend May ResumeHello traders! Here’s my technical outlook based on the current EURUSD (2H) chart structure. Price previously moved inside a descending channel, with lower highs confirming bearish pressure. The 1.1580 seller zone repeatedly capped upside, acting as strong resistance. After the decline, price found

GBPUSD 30Min Engaged ( Bullish & Bearish Entry Detected )⚡Base : Hanzo Trading Alpha Algorithm
The algorithm calculates volatility displacement vs liquidity recovery, identifying where probability meets imbalance.
It trades only where precision, volume, and manipulation intersect —only logic.
✈️ Technical Reasons
/ Direction — LONG / Reversal 1.33870 Ar

Sellers Taking Control in EUR/USDEUR/USD is showing a clear bearish setup after multiple rejections from the resistance zone near 1.1640 📉. Price failed to break higher and formed lower highs, indicating weakening bullish momentum. The trendline support has been broken, suggesting a shift toward selling pressure. Current price is c

See all forex ideas
Trade directly on Supercharts through our supported, fully-verified, and user-reviewed brokers.


